It all started on Monday evening when the Out Of Memory (OOM) killer decided to kill the database broker process, _mprosrv. Given the circumstances, it was suggested that we “just” reboot. “Just” is a four-letter word. Whenever you hear “just,” you should prepare yourself…
So we rebooted…
… and, of course, it took longer than expected. Forty-five minutes to shut down (mostly to “deactivate” swap), and then, since the server hadn’t been rebooted for 2 years, the filesystems needed another 45 minutes for an fsck. Ok, that was painful, but at least we have a nice clean system to restart the db.
Everything comes up and looks good. A few users get back online, and they are humming along; the overnight batch jobs can run on time. Everyone is happy.
Looking at ProTop Trends, it was clear that memory use had suddenly grown well beyond normal. The system has 505 GB of RAM, -B was only using 200 GB, and, overall, memory use was at 291 GB when it zapped _mprosrv, so that should not have happened. The system logs were not very helpful regarding who the culprit was or what they were up to, but there was some reason to think that an unusual SQL query had been running – so we decided to keep an eye on that.
Tuesday morning, things seem reasonable. The system is pretty busy, and although BogoMIPS looks kind of stressed out that made sense, given the previous day’s excitement. There aren’t any major issues with latch waits or blocked sessions, and CPU utilization seems reasonable.
Around lunchtime, a few users complained that some reports and similar things seem to be slower. They aren’t complaining about “normal processing” or anything with a “think time” component, but things that grab a lot of data seem to be running at half speed.
Ok, Time to Look Deeper
When I “look deeper,” I first compare the “today” view to the long-term trend. I generally start with a 7-day view and eventually zoom out to 30 and 90. This helps to identify any gross changes in behavior quickly.
And there is one!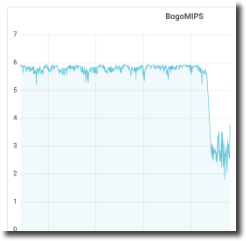
BogoMIPS isn’t merely “kind of stressed out.” It is about half of its previous value in the longer view, and it is wildly inconsistent. This is definitely not normal.
So what is BogoMIPS? It stands for Bogus Millions of Instructions Per Second. It is an ancient benchmarking technique that remains useful when comparing single-threaded performance levels. If you watch the Linux kernel boot process, you will notice that Linux reports a metric with this name. In ProTop, we simply time how long it takes to count from one to a million. In the old days, MIPS was often falsely portrayed as the One Metric To Rule Them All, but that’s bogus – thus the “bogo.”
Huge swings in BogoMIPS? Chances are the physical box is not delivering as expected—time to focus on the server and OS side of things.
It’s Not OpenEdge
OpenEdge-specific workload and performance metrics such as record read rates, transaction commit rates, blocked users, latch contention, and so forth are all close to normal.
The nightly backup went from one hour to two hours. Any known and measurable runtime is taking about twice as long as normal – regardless of whether an OpenEdge component is involved. We even wrote a little stand-alone “C” BogoMIPS program to double-check that Progress wasn’t somehow wrong about that!
Something is clearly wrong at the OS level.
The server is “bare metal,” with no virtualization layer to blame. The disks are all internal, so there are no SAN considerations at fault. There are two “identical” servers – server1 and server2. Server2 is not showing this behavior, but it is also not as heavily loaded. Let’s see if they are really “identical”? Well, what do you know! The two servers have some interesting differences. In particular, hyper-threading was OFF on server1 but ON on server2, and Linux kernel power management is missing from server1 but present on server2. After reviewing setup and installation notes (and screen captures), we can see that that is not supposed to be the case – something must have happened during the reboot.
Catch That BIOS!
Everything is pointing at a mismatch between BIOS settings and the kernel. So we scheduled another reboot and waited anxiously for the fleeting moment when you have a fraction of a second in which to strike the magic key combination to bring up the BIOS…

Success – BIOS is up. Ok, the clock is wrong, let’s fix the date and time. Everything else is correct and has (magically reset itself to?) all of the expected values.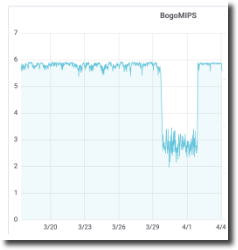
Finish the boot, watching the boot messages like a hawk… nothing interesting, good, the OS is up and running!
Ok, login, run the stand-alone BogoMIPS with fingers crossed…
Excellent results! The server1 numbers are comparable to server2 and without the previous wild variation. The databases and app servers restarted, and the replication targets resynchronized. Everything looks good so let the users in. Overnight the batch jobs and backups ran in the usual time, and the next day’s processing proceeds without complaints. Back to normal!
So how did BogoMIPS “save the day”?
The root cause is still unknown – we don’t know why the CPUs were running slow, although there are some fascinating bugs in the Red Hat knowledge base that we are pursuing. Or maybe it was fat fingers during the first reboot? We may never know since experiments that involve rebooting production servers are actively discouraged. On the other hand, we do have a quick and easy “canary in the coal mine” for any future reboots.
Having the BogoMIPS trend data immediately available and easily visualized clearly showed what the problem was, and it saved us from running down a *lot* of blind alleys. This metric kept us focused on what was observably true instead of spinning our wheels chasing after endless red herrings (like disabling CPUs, adjusting power save features, changing db startup parameters, or pursuing code changes) and provided a simple test of the impact of proposed solutions with an objective measure of success!