
Welcome to our monthly ProTop newsletter, where you’ll find out what’s new, tips and tricks and other cool ways to use both the free and commercial versions of ProTop.
Visibility is one of the key themes when it comes to ProTop, and having the ability to see how the various objects in your database are growing is the focus of the storage statistics trends dashboard.
Overview
The DBAs at WSS went back and forth quite a few times while developing this dashboard, always coming back to the same question: is this data, presented in this way, useful? Yes. It is. DBAs need to know how, where and when their databases are changing size.
In order to provide the most value, it is best to look at trends over weeks and months, and run DB analysis at least weekly. That’s right: weekly. Even daily. Ten years ago, we fretted over running DB analysis monthly, but with today’s solid-state infrastructure, many sites can and do run DB analysis nightly without affecting the business. The cost of DB analysis is roughly on par with the cost of an online probkup, so that should give you a pretty good idea of the effect of running DB analysis on your environment.
Use the ProTop Scheduler to run DB analysis so that the output will automatically be made available to ProTop. Otherwise, make sure to copy the file to the $PROTOP/dbanalys directory and name the file <ProTop friendly Name>.dba (ex.: sports2000.dba).
Important information first
How big is the database today? How fast is it growing? How big will it be next year?
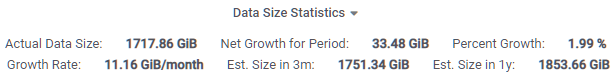
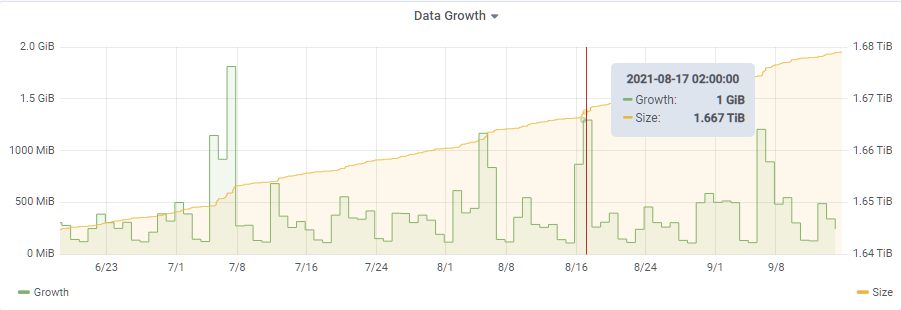
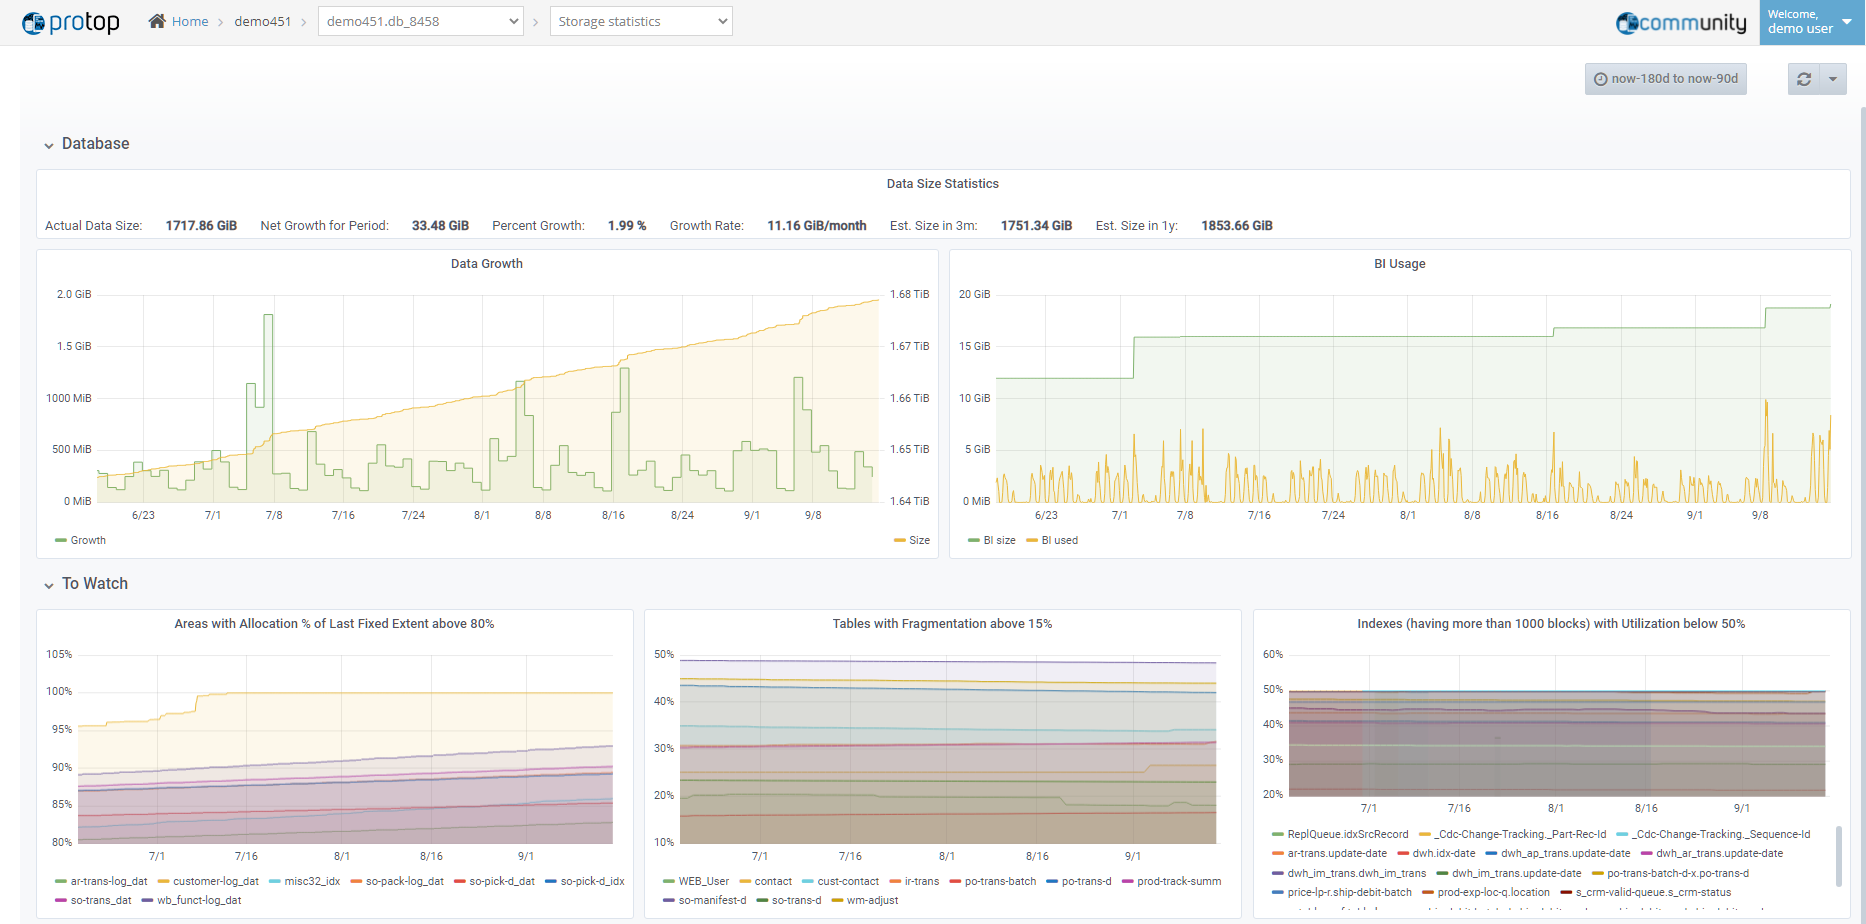
The uppermost section of the storage statistics dashboard shows you actual growth over the past months or years, and estimates future growth so that you can plan for your infrastructure needs.
What about the physical BI file? BI usage trends are visible in the main trends dashboard, but file size trends are graphed in the storage statistics dashboard.
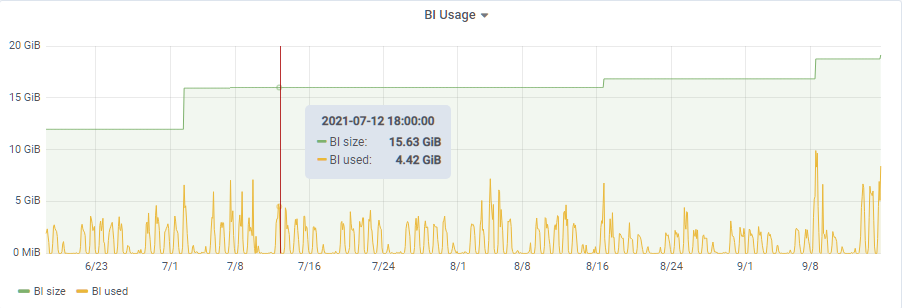
This provides an interesting perspective on how and when the physical BI file grows along with insight into how much of that space was “in use” at any time, allowing you to correlate sudden jumps in the graphs with known application events.
What other activity should you keep an eye on?
If you are using fixed length data extents, you will want to know which storage areas are at risk of spilling into the variable extent. ProTop has a pctLastX alert to proactively warn you, and the storage statistics dashboard provides a graphical view of the size of these storage areas.
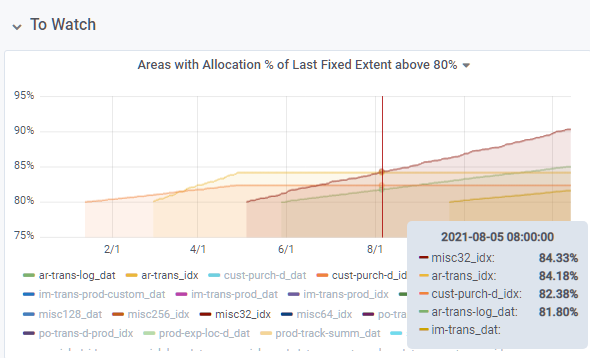
While we generally advocate for a simple “all variable length extents” approach for most OpenEdge databases, there are cases where fixed length extents are warranted (for instance, very large extents) or situations where the local DBA prefers to manage disk space explicitly. (How large is “very large”? It depends. Mostly it depends on how well your hardware and OS deal with very large files but in 2021 we find that line is usually somewhere between 20GB and 60GB. You definitely don’t want multiple hundred GB extents and OpenEdge has a hard limit at 1TB).
You will also want to know which tables are heavily fragmented. Fragmentation means that parts of records are stored in multiple blocks which means that you are doing extra IO to access that data:
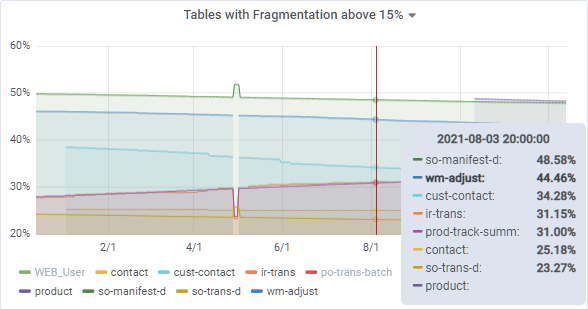
Fixing fragmentation typically requires a dump and load and potentially adjusting create and toss limits. You can also use proutil db -C tablereorg starting in OpenEdge 12.3.
A third important metric is index block utilization, helping the DBA understand which indexes would benefit from index compaction:
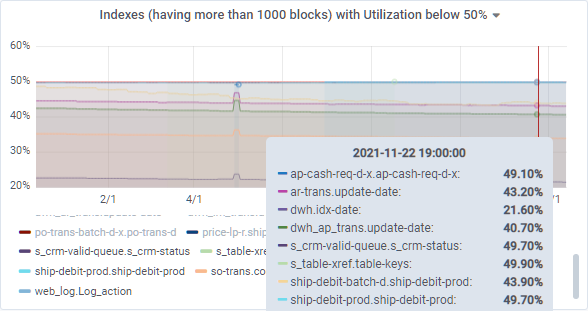
Low index block utilization means that it will take more database reads to traverse an index, potentially leading to performance degradation. We say “potentially” because it could be that the index in question is used very little, in which case the practical performance implication might be negligible.
Index compaction is easy to do and can be run online, though, as always, trying it in a test environment first is always prudent. Note that ProTop RT can generate the idxcompact script automatically through the DBAnalys Review and Report feature.
Areas, Tables, Indexes and LOBs
The next four sections in the dashboard highlight size and growth of storage areas, tables, indexes and LOBs. Each section has three tables and accompanying graphs: total size, absolute growth and percentage growth. We’ll show the table graphs for this blog post – area, index and lob sections are very similar.
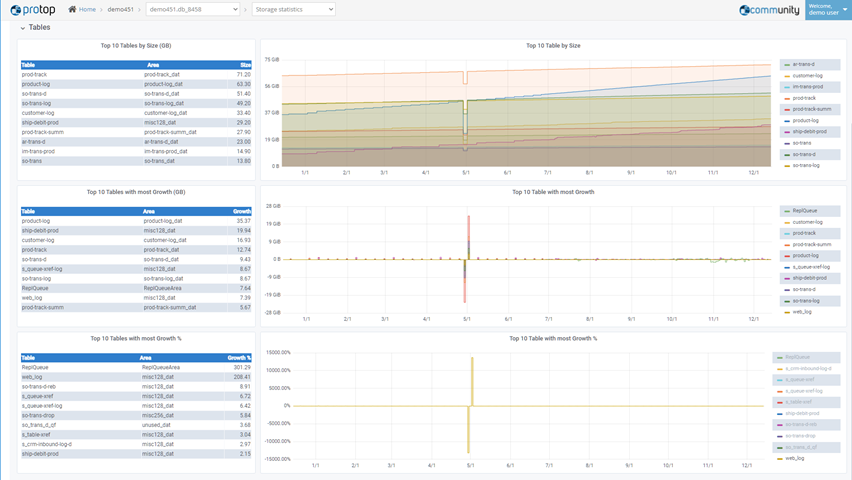
Take table “ship-debit-prod” as an example:
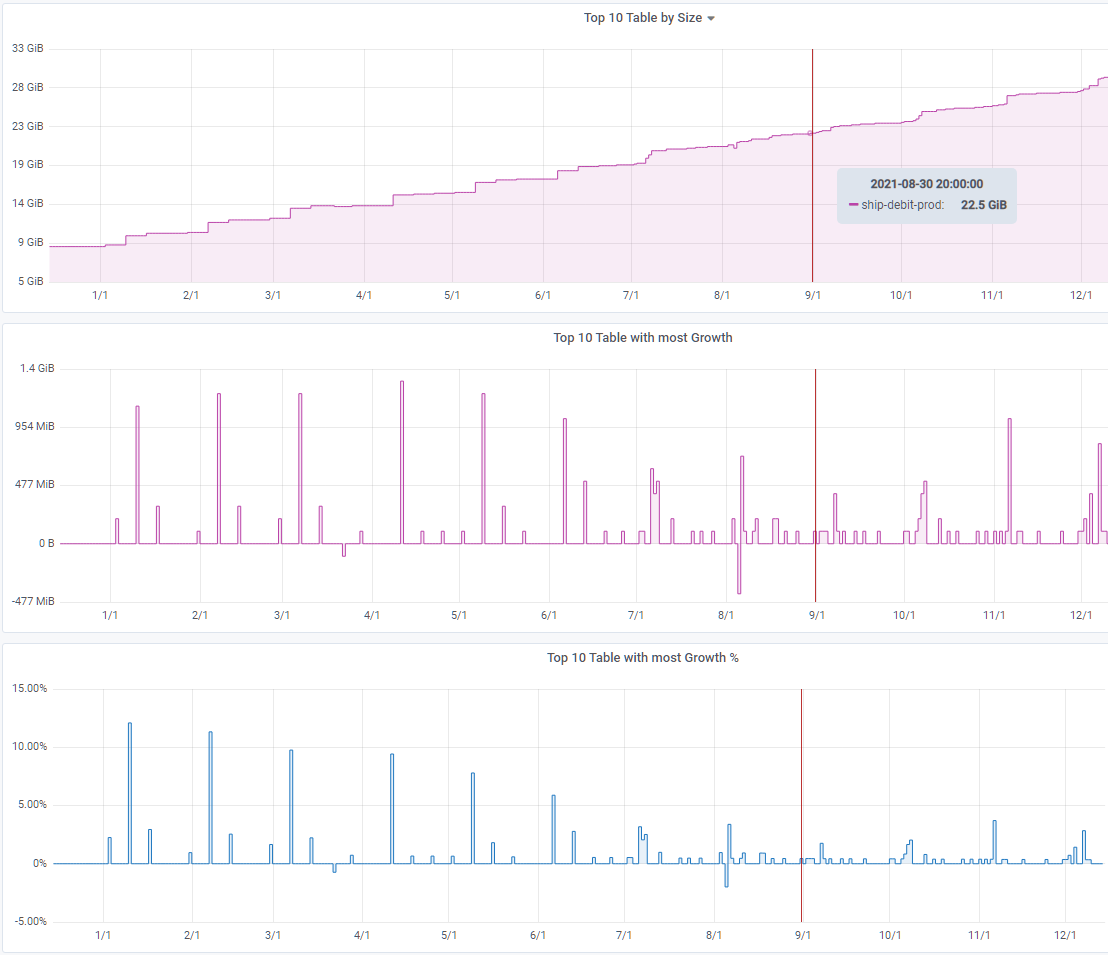
We can clearly see that table growth mostly occurs in spurts at regular intervals, growing upwards of 1 GB every month though the first half of 2021. Growth slowed down over the summer, only to pick up again in November.
Visibility simply makes a DBA’s life easier
To manage your OpenEdge environment, you need to see it. You need to see inside of it. That’s what ProTop does: it puts millions of data points, spanning years, right at your fingertips.
Whether it’s detailed CRUD statistics in the Table and Index Activity Dashboard or growth statistics in the Storage Statistics Dashboard, only ProTop provides the tools and visualizations to make your DBA life easier.
What’s next?
Would you like to suggest a cool new feature for ProTop? Have any questions or comments? Head over to our community page at https://community.wss.com.
Interested in learning more about the free ProTop RT (Real-Time)? The help pages at https://help.wss.com contained detailed instructions on how to install and configure ProTop RT.
Intrigued by the monitoring and alerting aspect of ProTop? Install the free version first, then reach out to us to activate a free trial and show you around the commercial features.
Want to learn more about being an OpenEdge DBA? Sign up to get all our blogs and updates in your inbox and subscribe to our YouTube page.