
Has your OpenEdge Database Application fallen victim to the Out Of Memory (OOM) Killer? Are you hunting for memory leaks? Use ProTop's "dirty memory" script on Linux to see which processes hold more private memory than others.
Linux memory, some context
In Unix-like operating systems, the memory used by processes is categorized into four types:
-
Shared_Clean: This type of memory is shared among multiple processes and contains read-only data that is not modified by any of the processes. The memory is clean, which means that it has not been modified.
-
Shared_Dirty: Similar to Shared_clean, this memory is shared among multiple processes but contains data that is modified by at least one of the processes. The memory is considered dirty because it has been modified.
-
Private_Clean: This type of memory is used exclusively by a single process and contains read-only data that is not modified by the process. The memory is clean, which means that it has not been modified.
-
Private_Dirty: Similar to Private_clean, this memory is used exclusively by a single process but contains data that is modified by the process. The memory is considered dirty because it has been modified.
In summary, "Shared" memory is shared between multiple processes, while "Private" memory is used exclusively by a single process. "Clean" memory refers to read-only data that has not been modified, while "Dirty" memory refers to data that has been modified. "Private" plus "Dirty" is the subject of this post.
Private_Dirty memory
This logic reports on non-shared resident memory per process - this is the unique memory burden of that process, also known as "Private_Dirty". This memory is returned to the system when the process ends.
We want to keep the sum of Private_Dirty memory plus the sum of all shared memory low enough to avoid any excuse for the OOM killer to act and bring down any of your OpenEdge processes (like the database!). As a rule of thumb, aim to leave 25%-50% of memory free for other purposes.
This report can also be helpful when looking for memory leaks over time. You can see if you have processes with slow but persistent memory growth by comparing hour-by-hour or day-by-day samples. Just create a root crontab entry to run this report as frequently as desired then analyze for suspicious changes.
To run this run report (as root from $PROTOP):
sudo bin/dirtymem.sh
The private dirty report
After you have run the script, look in $PROTOP/rpt for a private_dirty.rpt* file(s). Each report is time stamped so it will not be overwritten e.g. private_dirty.rpt.2023.03.28-10.17.27.
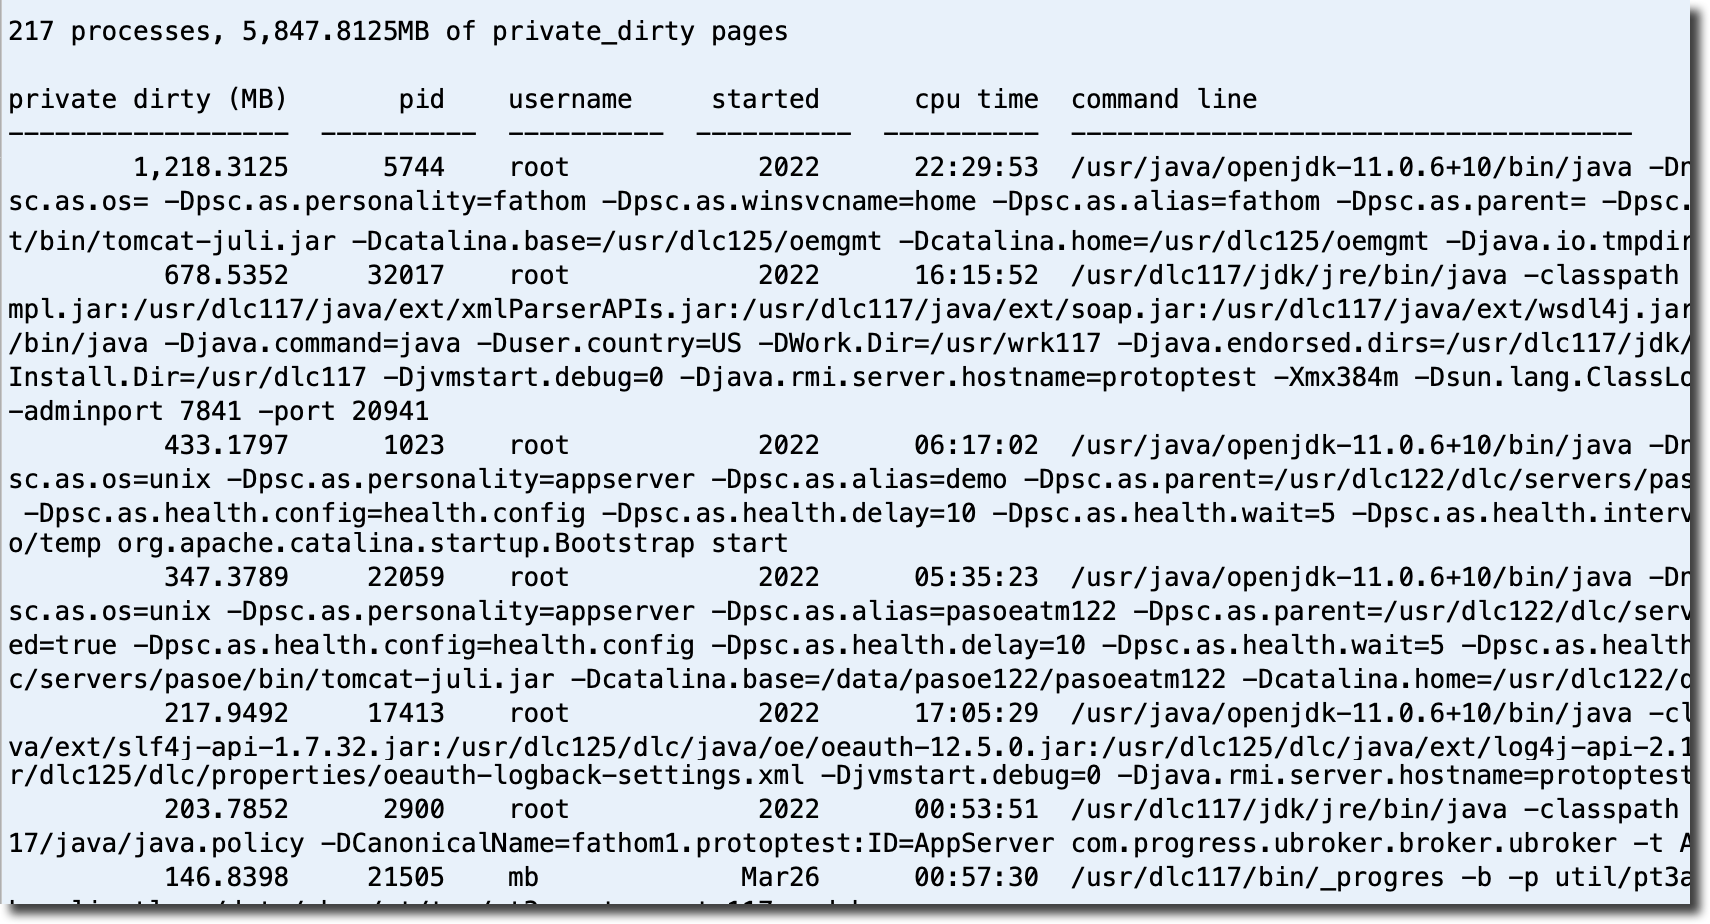
The report lists all processes and the amount of private dirty memory they hold in descending order. Here's a sample:
WARNINGS:
- You will get data for only your processes if you do not run the report as root.
- It can take several minutes on large systems to parse /proc/<PID>/smaps.
Related links:
- The Progress KBase entry on identifying and troubleshooting memory leaks
- Oracle's: Troubleshoot (Java) Memory Leaks
- See this WSS blog post from Paul Koufalis on memory: Understanding UNIX Performance Metrics - Part Two
So, How Much RAM A I Really Using?
Here's the story (YouTube video) behind dirtymem.sh told by the author, Tom Bascom. It provides and excellent introduction to OpenEdge memory usage and how to see it (and understand what you see):
Conclusion
OpenEdge database application memory issues can be challenging to root out. Use bin/dirtymem.sh to find processes in your OpenEdge environment that are taking up and holding on to too much memory, before the OOM killer kicks in and brings it down!