
Welcome to our monthly ProTop newsletter, where you’ll find out what’s new, tips and tricks and other cool ways to use both the free and commercial versions of ProTop.
In this issue, we’re going to give you the 10,000 metre overview of ProTop. Remember that most of ProTop is free, so we’ll make sure to point out when we’re describing commercial features.
Overview
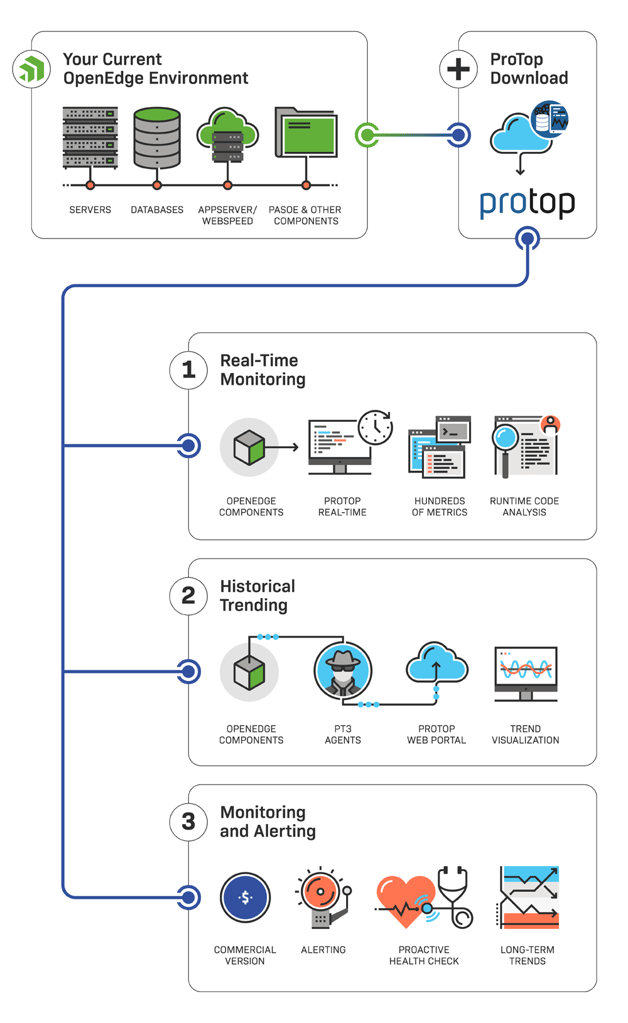
ProTop has three main components: monitoring, alerting and historical trending.
For real-time, on premise monitoring, you’ll want to use ProTop RT. This is what we introduced in the February newsletter. You can find instructions on how to download and install ProTop here.
Alerting is a commercial feature: when a monitored metric (there are over a thousand available) hits a threshold, an alert is generated. We currently have four alert levels of increasing severity: info (blue), alert (yellow), alarm (orange) and page (red), and you have quite a bit of flexibility in configuring which alert fires, when, how often, and what happens as a result.
Historical trending is partially free, partially commercial. A couple of days of historical data is visible to users of the free version of ProTop, provided they’ve configured their installation to upload data to one of our many global web portals (North America, Europe, Africa, Australia). In the commercial version of ProTop, there are many more graphical trends dashboards available, and potentially unlimited historical data.
You can see a detailed comparison between the versions on our web site at ProTop Plans and Pricing.
How Does ProTop Work?
Easy: you download ProTop and install it on your database server. ProTop is written in OpenEdge ABL, and currently supports 10.2B and up. The data collector programs take information from various sources and either present that data in ProTop RT (Real-Time) and/or upload data to one of the ProTop web portals. If you’re not interested in uploading data to a web portal and viewing historical data, then simply complete a “local install” and you’ll have full, free use of the real-time monitoring functionality.
What’s Next?
Interested in learning more about the free ProTop RT (Real-Time)? Make sure that you read our February newsletter, and head over to https://pt3help.wss.com for more detailed instructions on how to install and configure ProTop RT.
Intrigued by the monitoring and alerting aspect of ProTop? Install the free version first, then reach out to us to activate a free trial and show you around the commercial features.
Want to learn more about being an OpenEdge DBA? Sign up to get all our blogs and updates in your inbox and subscribe to our YouTube page.