
Welcome to our monthly ProTop newsletter, where you’ll find out what’s new, tips and tricks and other cool ways to use both the free and commercial versions of ProTop.
In this month’s issue: Programmer Mode, and why every developer should have the free version of ProTop RT (Real Time) up on their screen when writing queries.
What is programmer mode?
In a nutshell, programmer mode is a tweak to the ProTop RT user interface that enables the developer to see exactly what their code is doing to the poor innocent database.
More technically, it changes the sampling frequency from automatic to on demand, and the reported numbers from a rate (read/write/update/etc per second) to a summary number.
Put these together, and it means that you can run your program, refresh the counters in ProTop RT, and see exactly how many database operations your program did on a per-object basis.
OK – Show Me
If you’re dumb enough to let me [Paul] write code, you’re liable to get some really wonky results. Serves you right! Well $PROTOP/s2k_demo/churn.p is a great example of really bad code, even if it wasn’t me who wrote it. The churn program tries really hard to read the sports2000.vacation table about a million gajillion times.
In the example below, I am logged in to my development environment and I want to test my program.
First thing to do is fire up ProTop RT on the database server.

Second thing I want to do is figure out the user number of the user that’s going to run the test code. You can use the _MyConnection VST, or, if you’re using meaningful login names, look at the list of logged in users: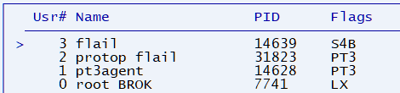
In this case, both ProTop and the test user are logged in using the appropriately named “flail” account.
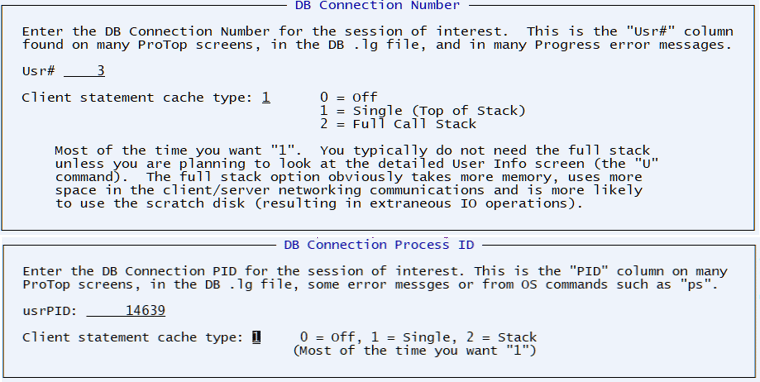
Next, let’s focus ProTop RT on that user #3 by drilling down to that connection. You can do that by hitting the “#” key to specify the DB Connection Number or “P” to specify the DB Connection Process ID. Either way, set the Client Statement Cache type to 1 – Single:
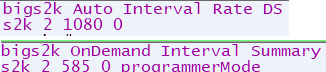
Next, enable Programmer Mode by hitting Ctrl-P. You’ll see the top-left change from “Auto Interval Rate” to “OnDemand Interval Summary”:
Now change the ProTop RT view to the User Information Viewer by hitting “U”, run your program, then hit spacebar to refresh the screen:
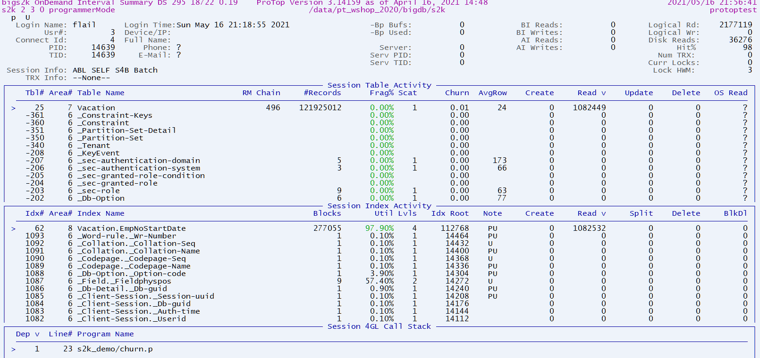
ProTop RT shows you the name and the line number of the [poorly written] program s2k_demo/churn.p, that on line 23, just read over a million vacation records plus another million index entries, resulting in over two million DB reads! Is the number of reads abnormal? Was that the index you expected to use? All that information is instantly available, simply by hitting spacebar to refresh the screen.
[I told you not to let me write any code!]
Gotchas !!
As always, YMMV, but generally speaking there are three main problems that are just itching to cause you grief:
- You are running some ancient version of OpenEdge when Client Statement Cache was somewhat problematic and its use was discouraged in production. Please check the KB, as there are isolated issues with specific combinations of operating system and OpenEdge version all the way up to 11.7.4.
- Some of your code runs on an AppServer, WebSpeed or PASOE agent. In this case, the easiest solution is to reduce the agent count to 1 (this is your dev environment) so that you can drill down to the agent
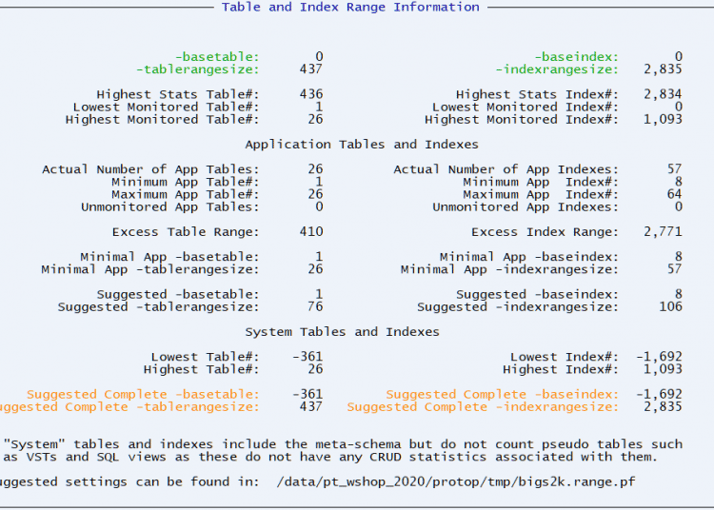
- You forgot to set -basetable, -baseindex, -tablerangesize and -indexrangesize and so the table and index statistic information is simply not available. Luckily, the optimal values can be found by hitting “T” in ProTop:
What’s Next?
Would you like to suggest a cool new feature for ProTop? Have any questions or comments? Head over to our community page at https://community.wss.com.
Interested in learning more about the free ProTop RT (Real-Time)? The help pages at https://pt3help.wss.com contained detailed instructions on how to install and configure ProTop RT.
Intrigued by the monitoring and alerting aspect of ProTop? Install the free version first, then reach out to us to activate a free trial and show you around the commercial features.
Want to learn more about being an OpenEdge DBA? Sign up to get all our blogs and updates in your inbox and subscribe to our YouTube page.