
Welcome to our monthly ProTop newsletter, where you’ll find out what’s new, tips and tricks and other cool ways to use both the free and commercial versions of ProTop.
What is going on with the database!?! Lack of visibility is a complaint we often hear, and ProTop specifically exists to address this complaint. This month we are going to dive into one of the most valuable (and free!) features in ProTop RT: users of a table and users of an index.
Overview
These free features in ProTop RT are immensely powerful, and you should have them ready to use in your environment. To make things simple, we’ll use our friend the sports database and some poorly written code (in Tom’s defense, he wrote these programs poorly on purpose!) to show you how to determine exactly which tables and indexes are the victims of excessive activity, which processes are guilty and even what code is being executed.
Main View
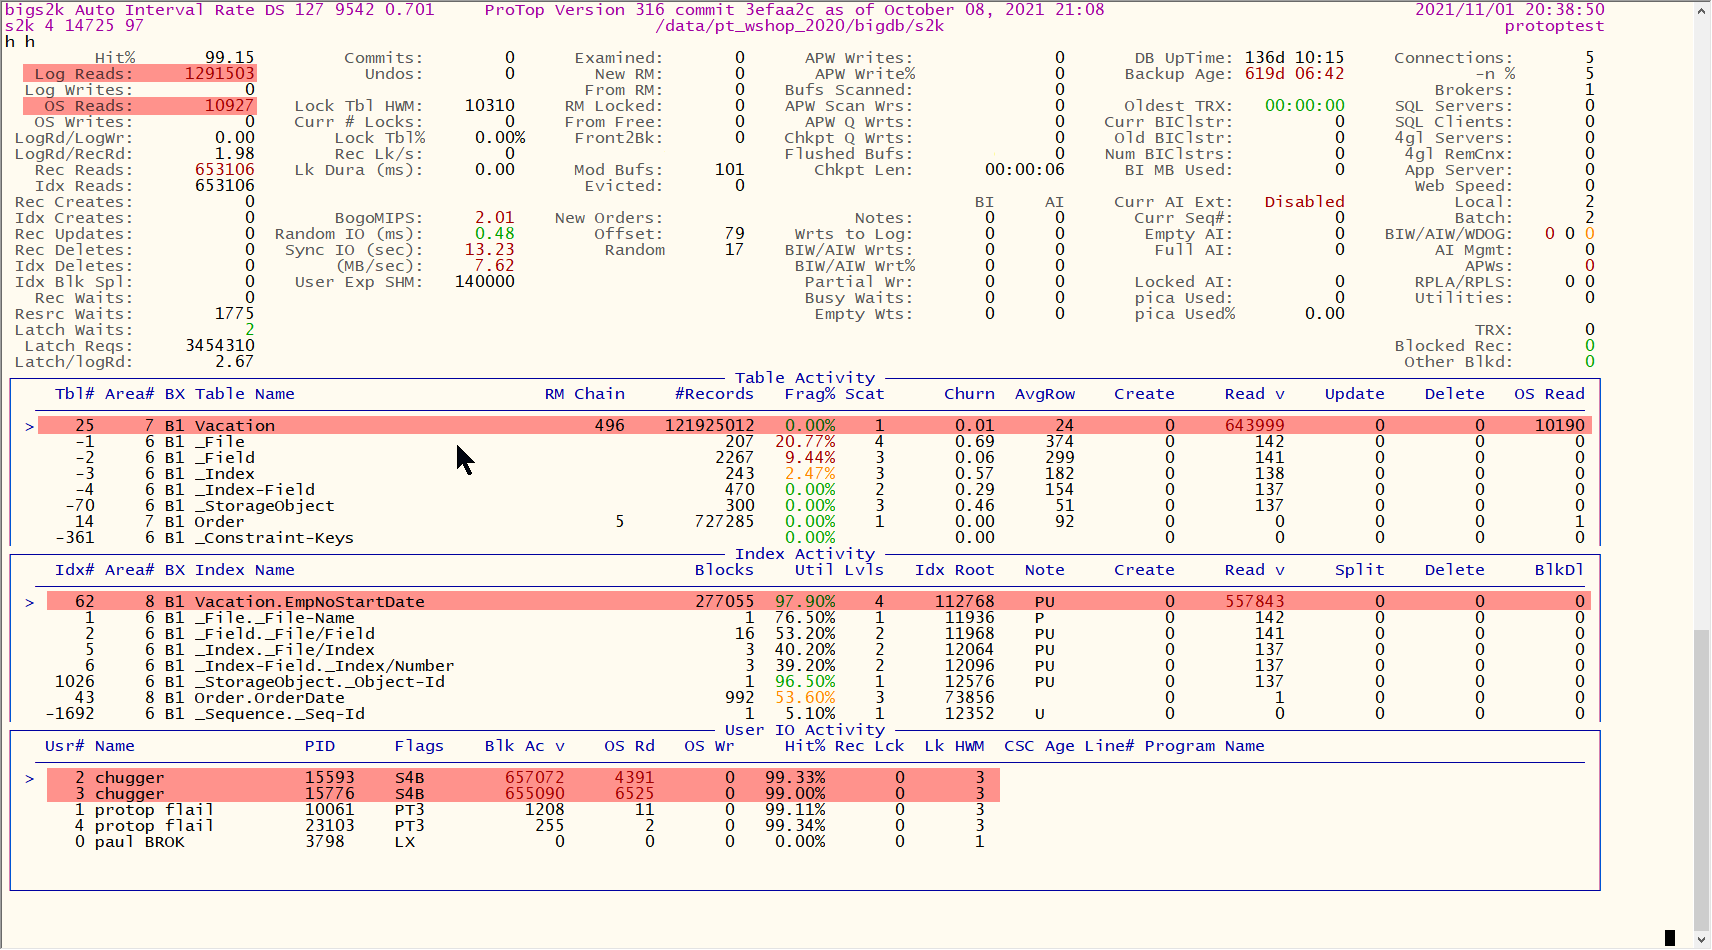
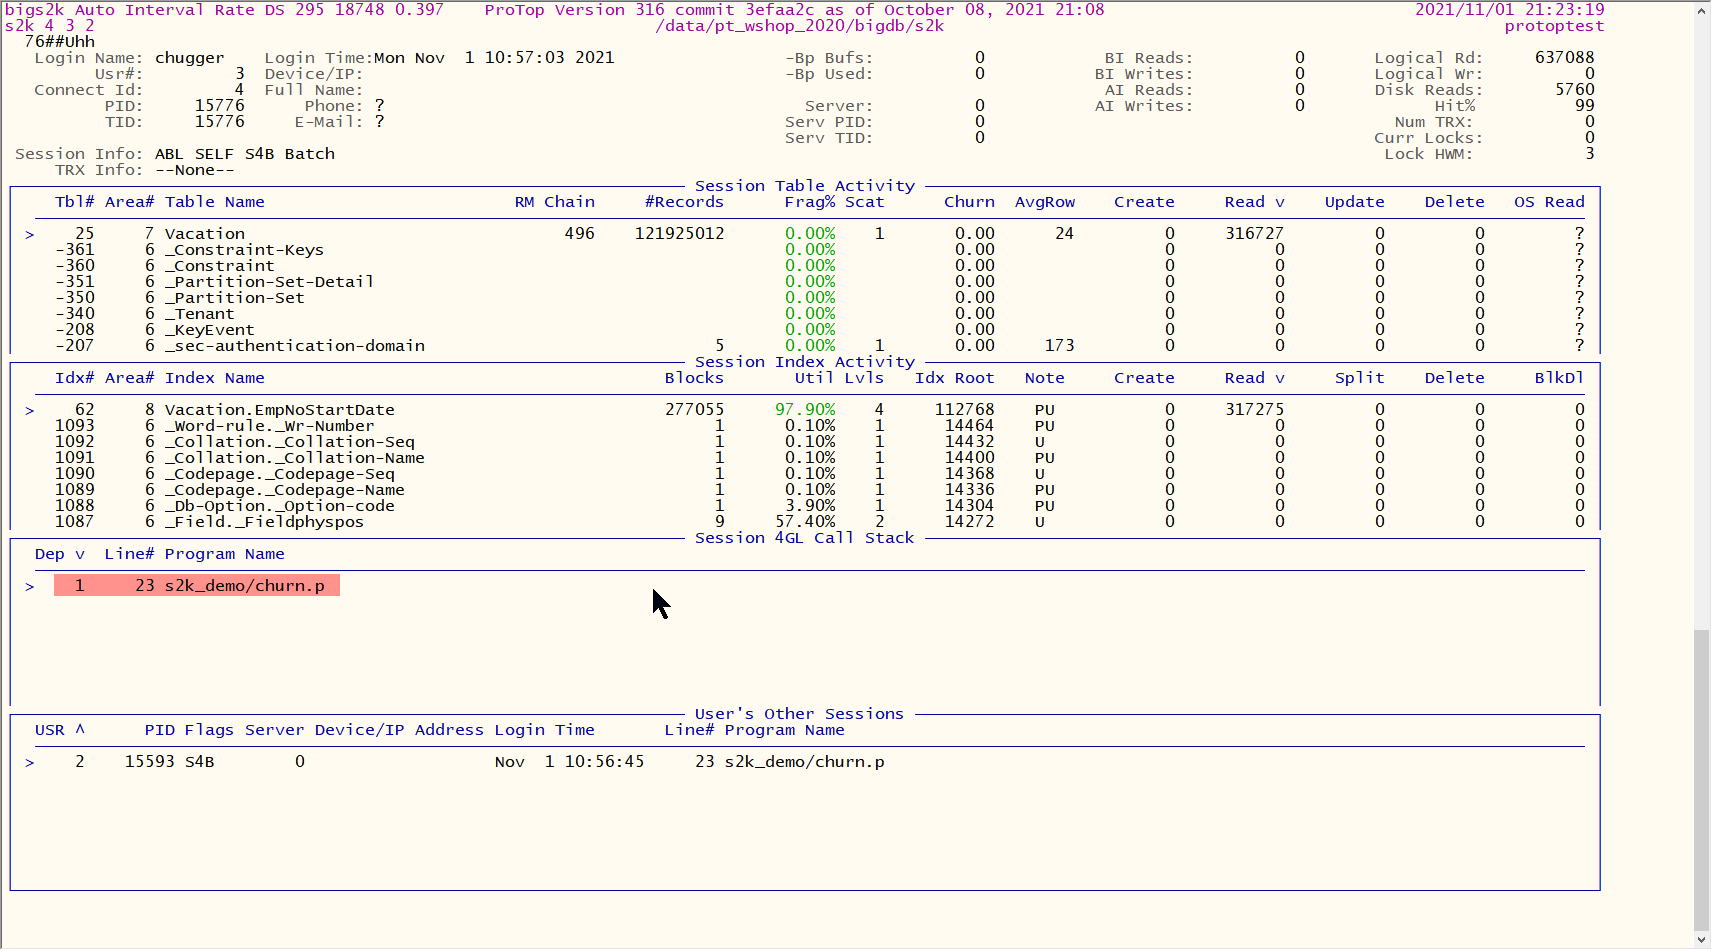
Firing up ProTop RT, it doesn’t take long to notice that the 1.29M logical reads/second (top left corner of below image) are more-or-less split evenly between table reads on the Vacation table (644K reads/sec in the Table Activity panel) and the Vacation.EmpNoStartDate index (558K reads/sec in the Index Activity panel). Looking at the User IO Activity panel, it seems pretty clear that users #2 and #3 (PIDS 15593 and 15776) are the guilty parties, but in a real-world environment with hundreds of users reading multiple tables, the correlation might not be so clear-cut.
Users of a Table and Users of an Index
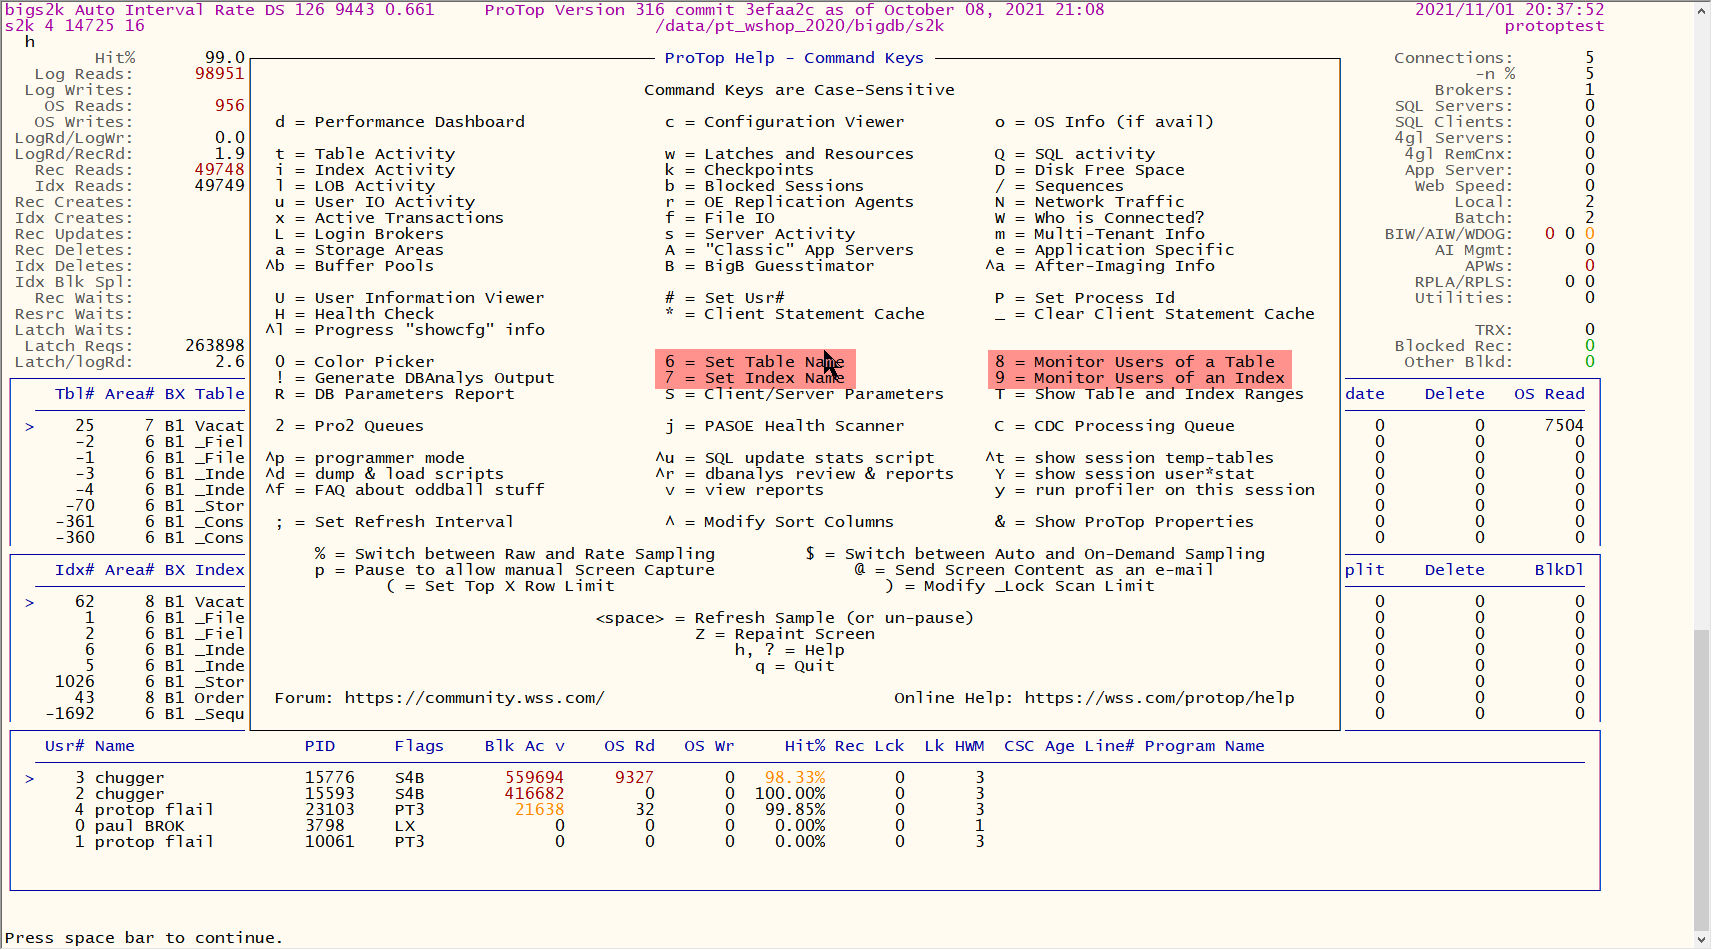
From the ProTop help screen, you will need to first set the table name (option 6) and/or the index name (option 7), then display the “Monitor Users of a Table” panel (option 8) and/or “Monitor Users of an Index” panel (option 9).
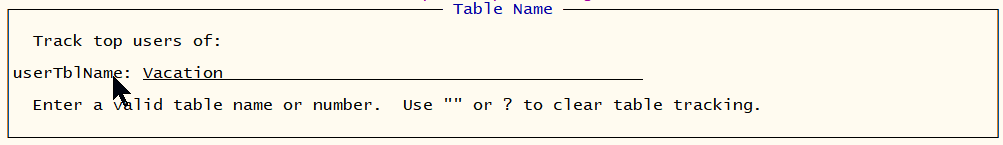
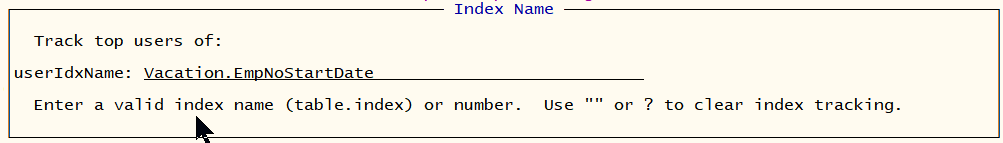
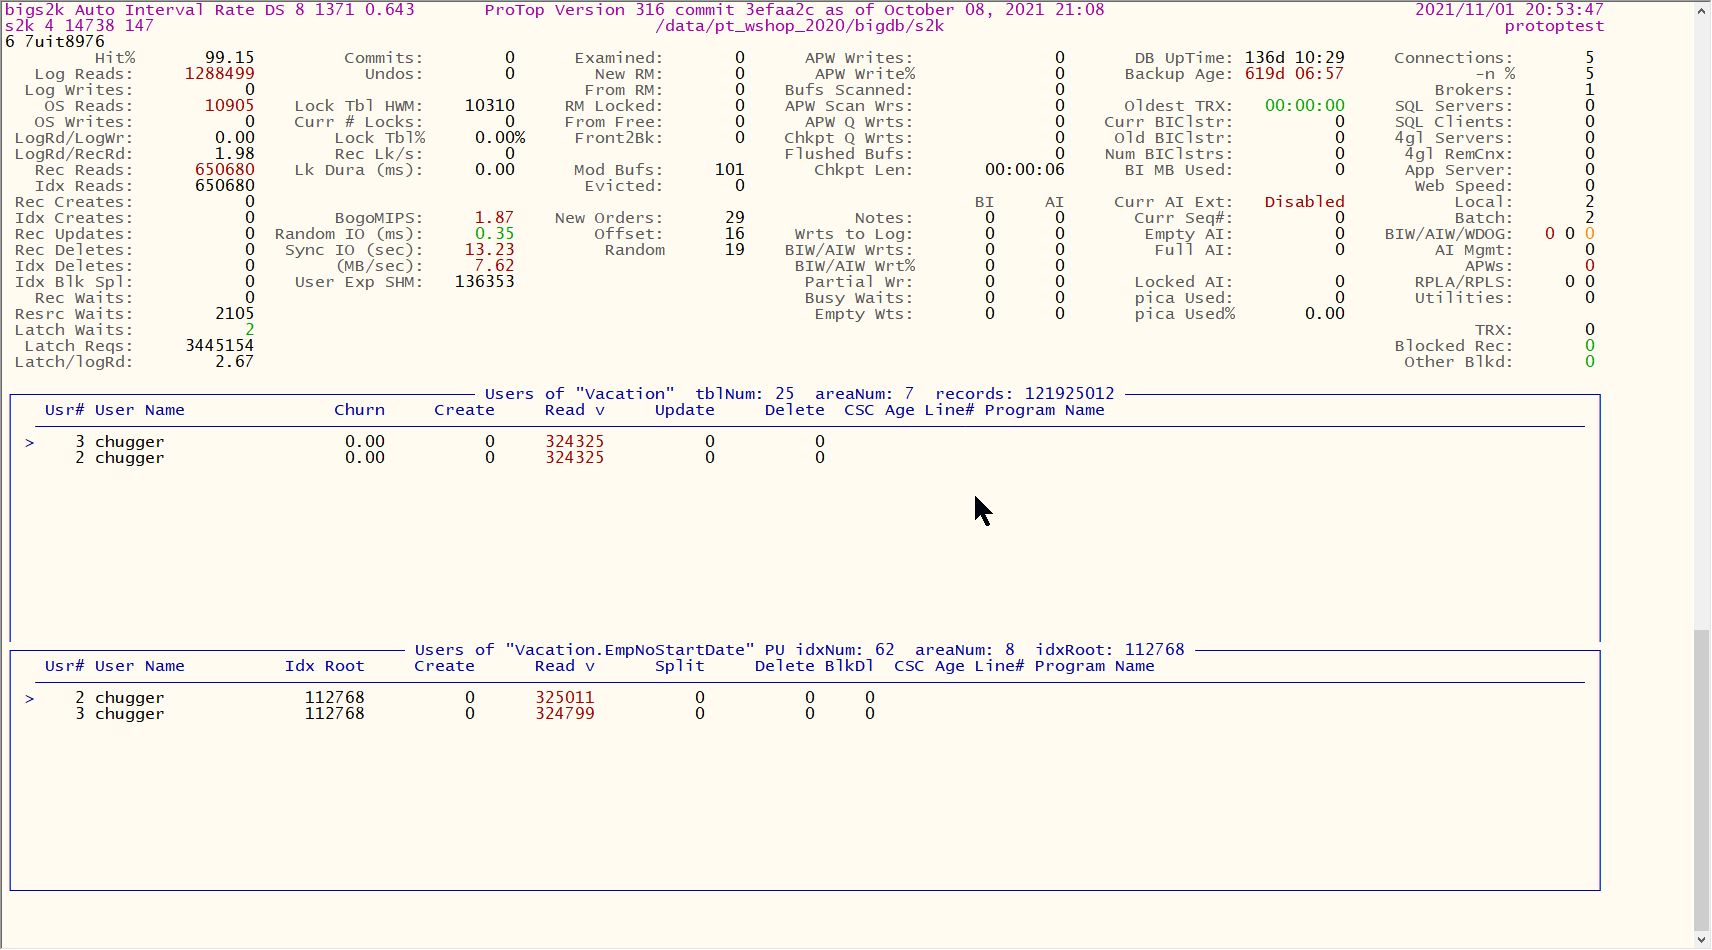
Let’s do it! In the example below, I selected options 6 and 7 to set the table and index names, then I hit “u” to hide the “User IO Activity” panel, “i” to hide the “Index Activity” panel, “t” to hide the “Table Activity” panel, then 8 and 9 to display the “Users of Vacation Table” and “Users of Vacation.EmpNoStartDate Index” panels:
But What Code are They Running?
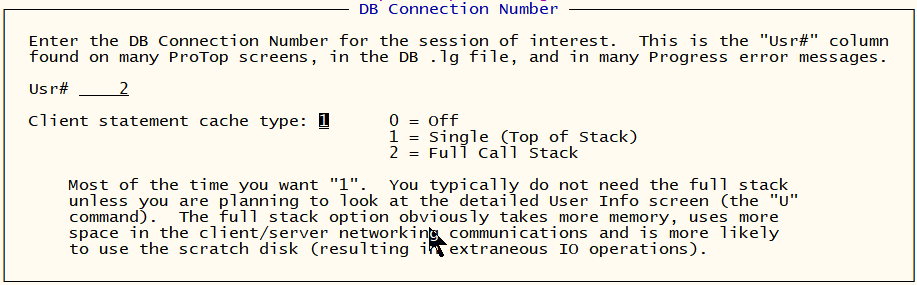
Enable Client Statement Cache (CSC) for these two users to see what code they are running. Use the “#” key to select user #2, and set the CSC type to “1 = Single”. You can also use the “P” key to select a user by PID rather than user #.
Repeat for user #3 and wait for the screen to refresh:
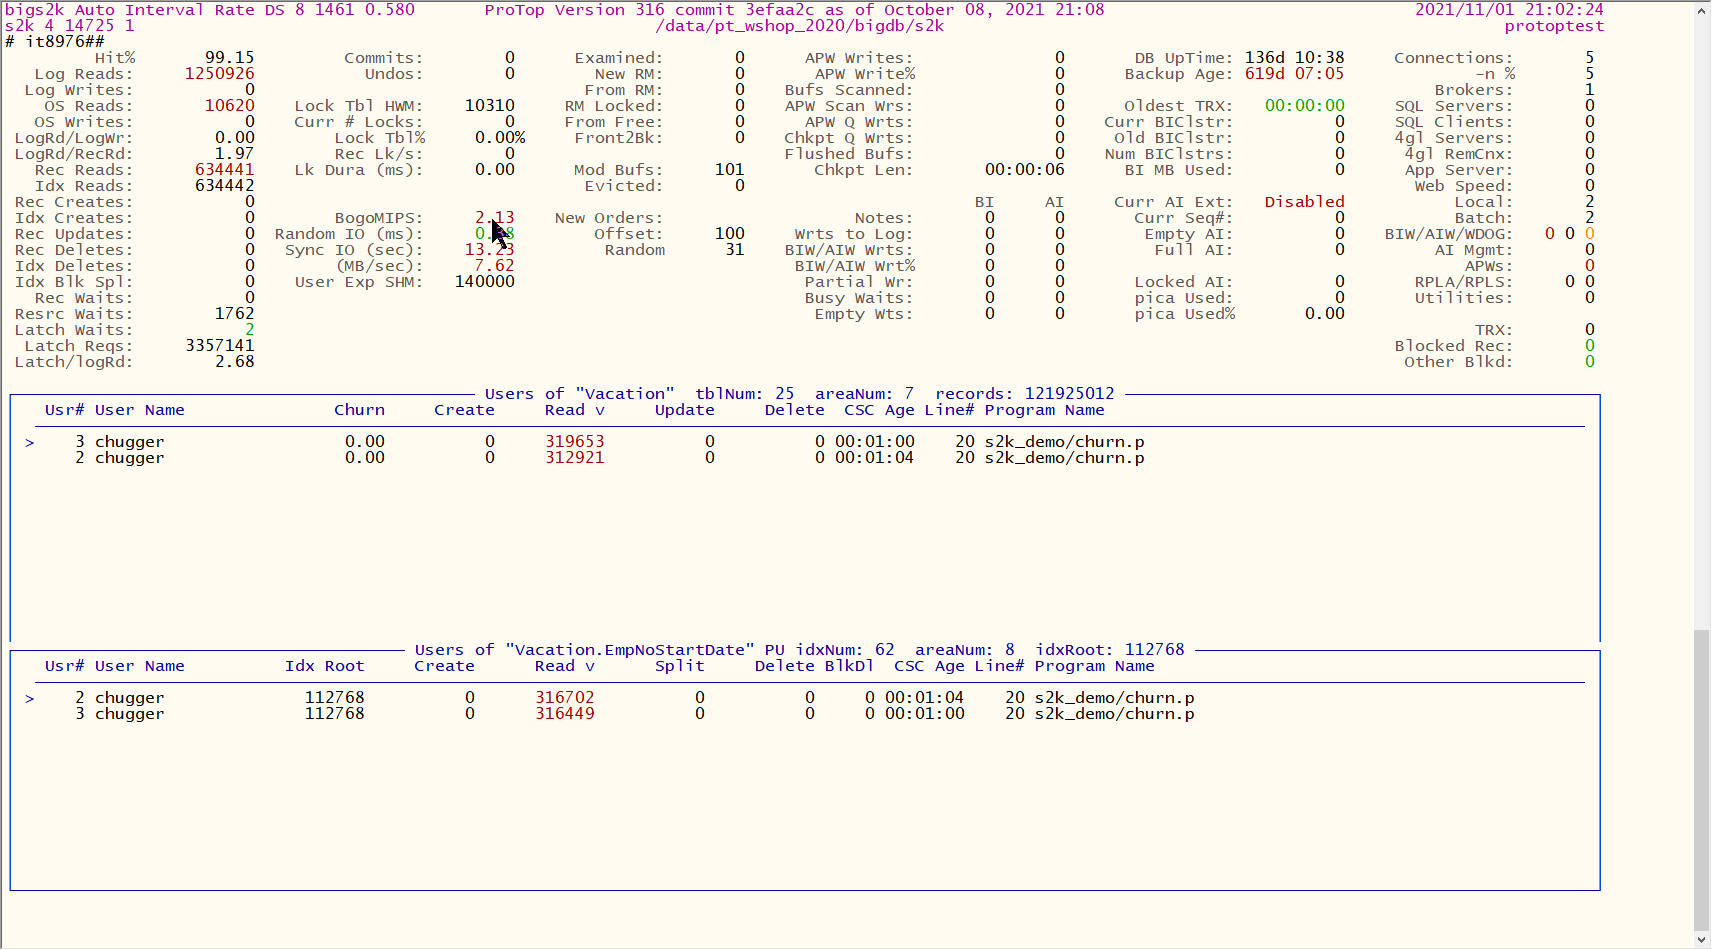
It’s important to note that CSC is forward looking. If the user was running a long query that started before CSC was enabled, then the Line# and Program Name fields would not populate until the next database query.
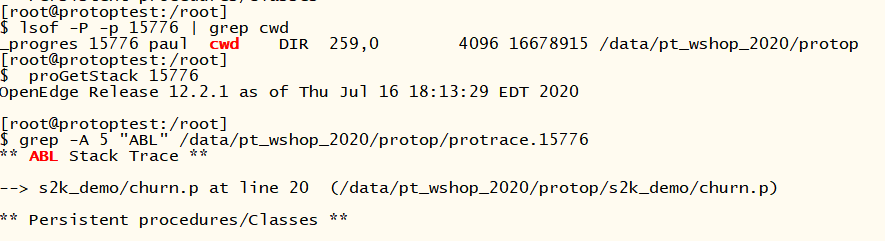
In this case, use the proGetStack utility. This will create a protrace.<pid> file in the process’ working directory and the program stack will be written to the “ABL Stack Trace” section:
Drill Down User View
As a reminder, you can also focus on one particular user with the User Information View. This displays detailed transaction and database activity statistics for the selected user.
Improving a DBA’s Life
We are OpenEdge DBAs first, and have been for 25++ years! We built ProTop for us, to make us faster, more efficient and more precise when supporting our customers all around the world. ProTop RT is by far the best OpenEdge monitoring tool available, and no self-respecting OpenEdge DBA should be without it. Best of all, it’s absolutely free!
What’s next?
Would you like to suggest a cool new feature for ProTop? Have any questions or comments? Head over to our community page at https://community.wss.com.
Interested in learning more about the free ProTop RT (Real-Time)? The help pages at https://help.wss.com contained detailed instructions on how to install and configure ProTop RT.
Intrigued by the monitoring and alerting aspect of ProTop? Install the free version first, then reach out to us to activate a free trial and show you around the commercial features.
Want to learn more about being an OpenEdge DBA? Sign up to get all our blogs and updates in your inbox and subscribe to our YouTube page.