
Every experienced IT person knows that bad things tend to happen on Fridays, and Friday evening is when we got alerted: major performance problems on the primary database server at one of our Enterprise clients.
Kick in the high-availability (HA) plan…
The application in question requires near-instant response time, as there is a human customer somewhere in the world waiting for a reply. Processing was immediately routed to the HA environment and we confirmed that the issue was resolved from an end-user perspective.
Now it was up to the support team to investigate the performance issue on the primary server.
Do you have a HA failover environment? A topic for another day…
Ok, time to look deeper
When I “look deeper,” I first compare the “today” view to the long-term trend. I generally start with a 7-day view and eventually zoom out to 30 and 90. This helps to identify any gross changes in behavior quickly.
And there were TWO !
Even without defining the contents of the graphs below, it’s pretty clear that something started happening around 15:00 last Friday.
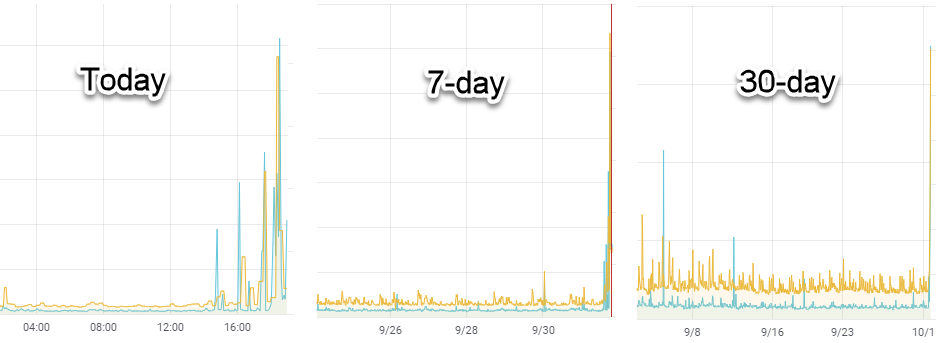
So what are these graphs?
SyncIO and random reads.
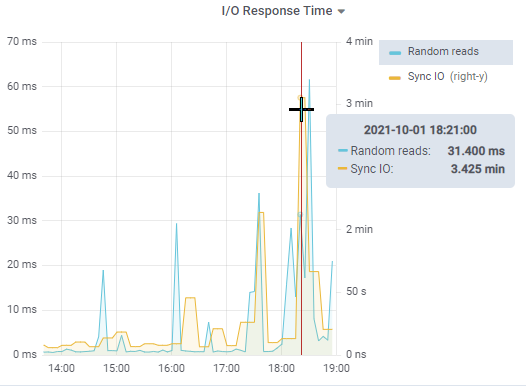
- We have discussed syncIO in various blog posts in the past: syncIO is a measure of unbuffered disk write performance. In a nutshell, it measures how fast the various OpenEdge processes can write data to the AI and BI files, as those writes are not buffered by the operating system.
The details are worth repeating: - The syncIO metric measures the time it takes to create a 96 MB BI file (6 BI clusters of 16 MB each) using the bigrow option of the proutil command. If it takes 10 seconds (which is typical for a SAN), then the unbuffered write throughput is roughly 9.6 MB per second.
- Writes to the AI and BI files are not buffered by the operating system, and the OpenEdge processes writing the AI/BI data must wait until the write completes before continuing. AI and BI blocks are typically 16 KB, so if the unbuffered write throughput is 9.6 MB/sec, writing an AI or BI block to disk should take around 1.5 ms.
- If the BI file needs to grow by one BI cluster, all forward processing stops during the cluster’s grow-and-format process. If your BI cluster size is 64 MB, and your unbuffered disk throughput is 9.6 MB/sec, then it is going to take 6-7 seconds to create that new BI cluster, during which time no changes can be made to the database!
A throughput of less than 10 MB/sec is pretty bad, and will likely affect the business during write-intensive processes. During this incident, unbuffered write throughput registered as low as 500 KB/sec. Yes, you read that correctly: HALF a MB per second. Writing a single 16 KB AI or BI buffer to disk took over 30 ms, and formatting a 64 MB BI cluster would have wreaked havoc for 128 seconds.
File system cache vs buffered and unbuffered IO
Regular file system writes always pass through the file system cache.
*Buffered* writes might remain in the FS cache for some time, until the operating system decides to write the changes to disk.
*Unbuffered* writes to the FS cache are immediately sync’d to disk, and the writing process typically blocks and waits for the write to finish.
Want to learn more? Read this KB entry on AI/BI and WAL
The random reads metric measures how fast an OpenEdge process can read a random database block from disk. Disk vendors tend to brag about how fast they can stream data in large, contiguous chunks, but transactional applications do not read data this way. We expect to see values in the single-digit milliseconds or faster, but in the above graph you can clearly see a data point above 60 ms.
Correlate correlate correlate
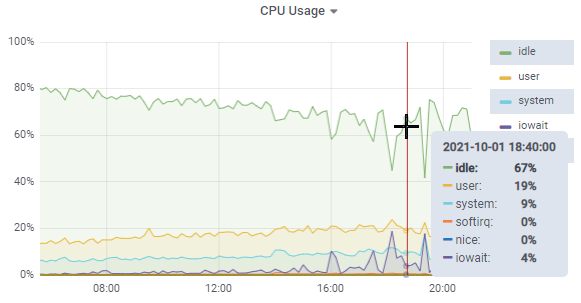
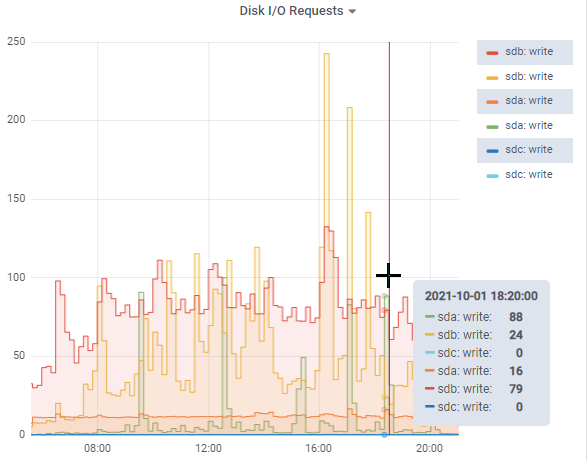
ProTop collects over a thousand different metrics and optionally uploads them to our cloud servers, making it easy to look for patterns. In this case, CPUs were mostly idle, though we did see some spikes in raw disk IO:
I also checked the other databases on this server, and none seemed to be doing anything particularly interesting.
This sounds familiar…
Exactly one month ago the same thing happened:

At that time, we also suspected a SAN issue, and the storage administrators opened a support request with the SAN vendor. Clearly, no action was taken.
Keep digging
By 9:00 PM, there were a dozen people on the zoom call, and the VMWare administrator shared the performance console for the physical frame running this VM. Surprise surprise: there was an Oracle VM absolutely drowning the storage network. And to make things worse, it was a UAT (user acceptance testing) VM. Not even a production machine!
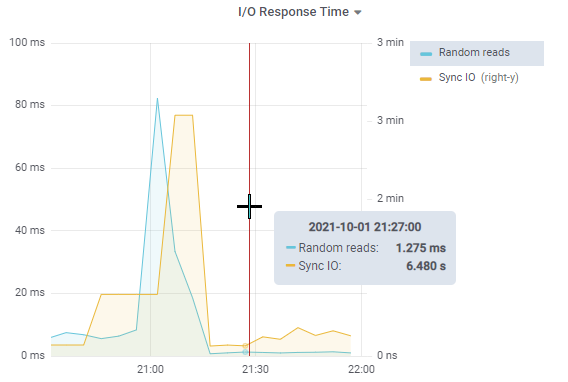
Since this was not a production VM, no change request was needed, and the VMWare administrator vmotion’d the server to another physical server. The result was instantaneous: syncIO dropped from 3 minutes to around 6 seconds and random reads dropped from 80 ms to 1.275 ms.
Problem solved.
So how did syncIO “save the day”?
It was clear and inarguable that there was a disk IO irregularity. We had the data. Without this data, it seems unlikely that the support team would have correlated activity on a non-production Oracle VM with performance issues on a production OpenEdge server.
When the same issue occurred a month ago, the system administrators opened a ticket with the SAN vendor, who proceeded to verify, correctly, that there was no issue with the SAN.
The second time it happened, the system administrators knew to dig a little deeper into their systems and were able to discover the bandwidth-hogging activities of the Oracle VM.
What did we learn from this event?
- Data is king. The only way to know if some behaviour has changed is to have to have the historical trend data.
- Mixing production and non-production services is problematic and should be avoided as much as possible. This is one of the many challenges support teams face as supposed cost savings take precedence over performance and availability. You will often hear a White Star Software speaker say “SANs are an accounting tool, not a performance tool.” More generally, virtualization and shared resources are solutions to allow an IT department to more efficiently use computing resources, sometimes at the cost of performance and availability.
- Monitoring needs to be multi-faceted. You need to monitor resources, whether application, database, operating system or infrastructure, from multiple perspectives, because problems may manifest themselves in different ways. In this case, system monitoring noticed high bandwidth usage of the storage network while ProTop alerted to a disk IO performance issue affecting the OpenEdge stack. Same problem – different perspectives, allowing us to more quickly find and correct the root cause.