
Use ProTop to monitor and alert for lock table usage and discover the cause of lock table overflows in your database application.
What is a lock table overflow in OpenEdge?
Simply put, the database lock table will overflow when the application attempts to lock more records than the current database configuration (-L) allows. It will result in a message like this in the database log file:
The database will increase -L automatically until the space allocated by -Mxs is used up, at which point a fatal error occurs:
The database shuts down, and all open transactions are lost.
What should -L be set to?
For a new (installation of an) application, setting -L through trial and error is a growing pain and will likely be discovered during development and testing. If you see these errors, increase -L and start again.
For a well-established system, sudden lock table overflows can indicate the introduction of new code with a transaction scope issue. Or, it may simply indicate growth. As your user base increases over time, so will the demand for the lock table.
ProTop does call out a low -L in etc/alert.*.cfg (50000) and during its automated health check (bin/hc.sh), so if you are wondering, start with 50000, monitor, and increase as needed. Increasing -L can be done online for standalone and source replication databases:
proutil <db> -C increaseto -L <n>
Max out -L?
Why not just set it very high and forget about it? Each entry uses 64 bytes of RAM and is only limited by available memory, so you'll want to set it to an appropriate level for your application. Moreover, setting -L too high can hide lousy code that might contribute to other application problems, such as transactions that run too long or that block other sessions from getting their work done promptly.
Leveraging ProTop's default lock table monitoring
ProTop monitors the database log file for lock table overflow error messages by default. It is defined in etc/messages.cfg:
"915" "alert" 3600 1 "(915) Lock table overflow, increase -L on server"
When ProTop sees error "915", it passes the error message to the ProTop Portal as an "alert." Consider making it an "alarm" to get an email while actively investigating locking issues so you have a better chance of catching the code in the act. Change the nag frequency as well, once an hour, 3600, is likey too infrequent for active investigation.
ProTop monitors the current lock table size (-L) by default from your etc/alert.*.cfg:
lkTableSize    num   <     50000   "" "daily" "&1 &2 &3" alert
lkTableSize    num   >    500000   "" "daily" "&1 &2 &3" alert
This will let you know if your database started with an unexpected value. For instance, if you have faced a lock table overflow and OpenEdge has automatically increased -L, this alert can give you a heads-up that you might need to set that value in your database startup parameter files.
For OE Replication users As indicated above, -L can grow until -Mxs is exhausted. Keep in mind if -L does auto-increase on a source replication database, the target -L will need to be increased as well to restart. To see what the current -L is on the source, start ProTop and use the "c" command key to bring up the configuration dashboard. You will see "Lock Tbl (-L)" in the center of the top row of data. Set this value in your target db startup pf file and restart the target database.
Alert for high user lock counts
ProTop can monitor and alert for a high number of locks in on a per user basis. Remove the # from the beginning of these lines your etc/alert.*.cfg and change 500 to an appropriate value for your situation:
# recLks  num  >  500  "" "hourly" "Locks in use &1 &2 &3" zUserLocks,alert
# lkHWM   num  >  500  "" "hourly" "Session Lock HWM &1 &2 &3" zUserLkHWM,alert
Change "alert" to "alarm" or "page" if you want to be contacted when this threshold is exceeded. You'll likely want to increase the frequency of these alerts to something more than "hourly" while you are actively investigating locking issues.
The action zUserLocks shows users with the highest numbers of record locks in descending order. And zUserLkHWM is the same as zUserLocks in descending order by high water mark. These details are added to the alert message before sending it to the ProTop Portal.
NOTE: These metrics require including the "UserIOActivity" data collector in your etc/pt3agent.*.cfg ptInitDC variable. This should be used only while actively investigating high lock table entry sessions that elude ProTop RT research and is not a very good idea on very busy systems. If you use it, remember to shut it off again after completing your research.
Using ProTop RT to investigate locks
When you first start ProTop RT in its default configuration, you are immediately presented with insights into your current locking situation: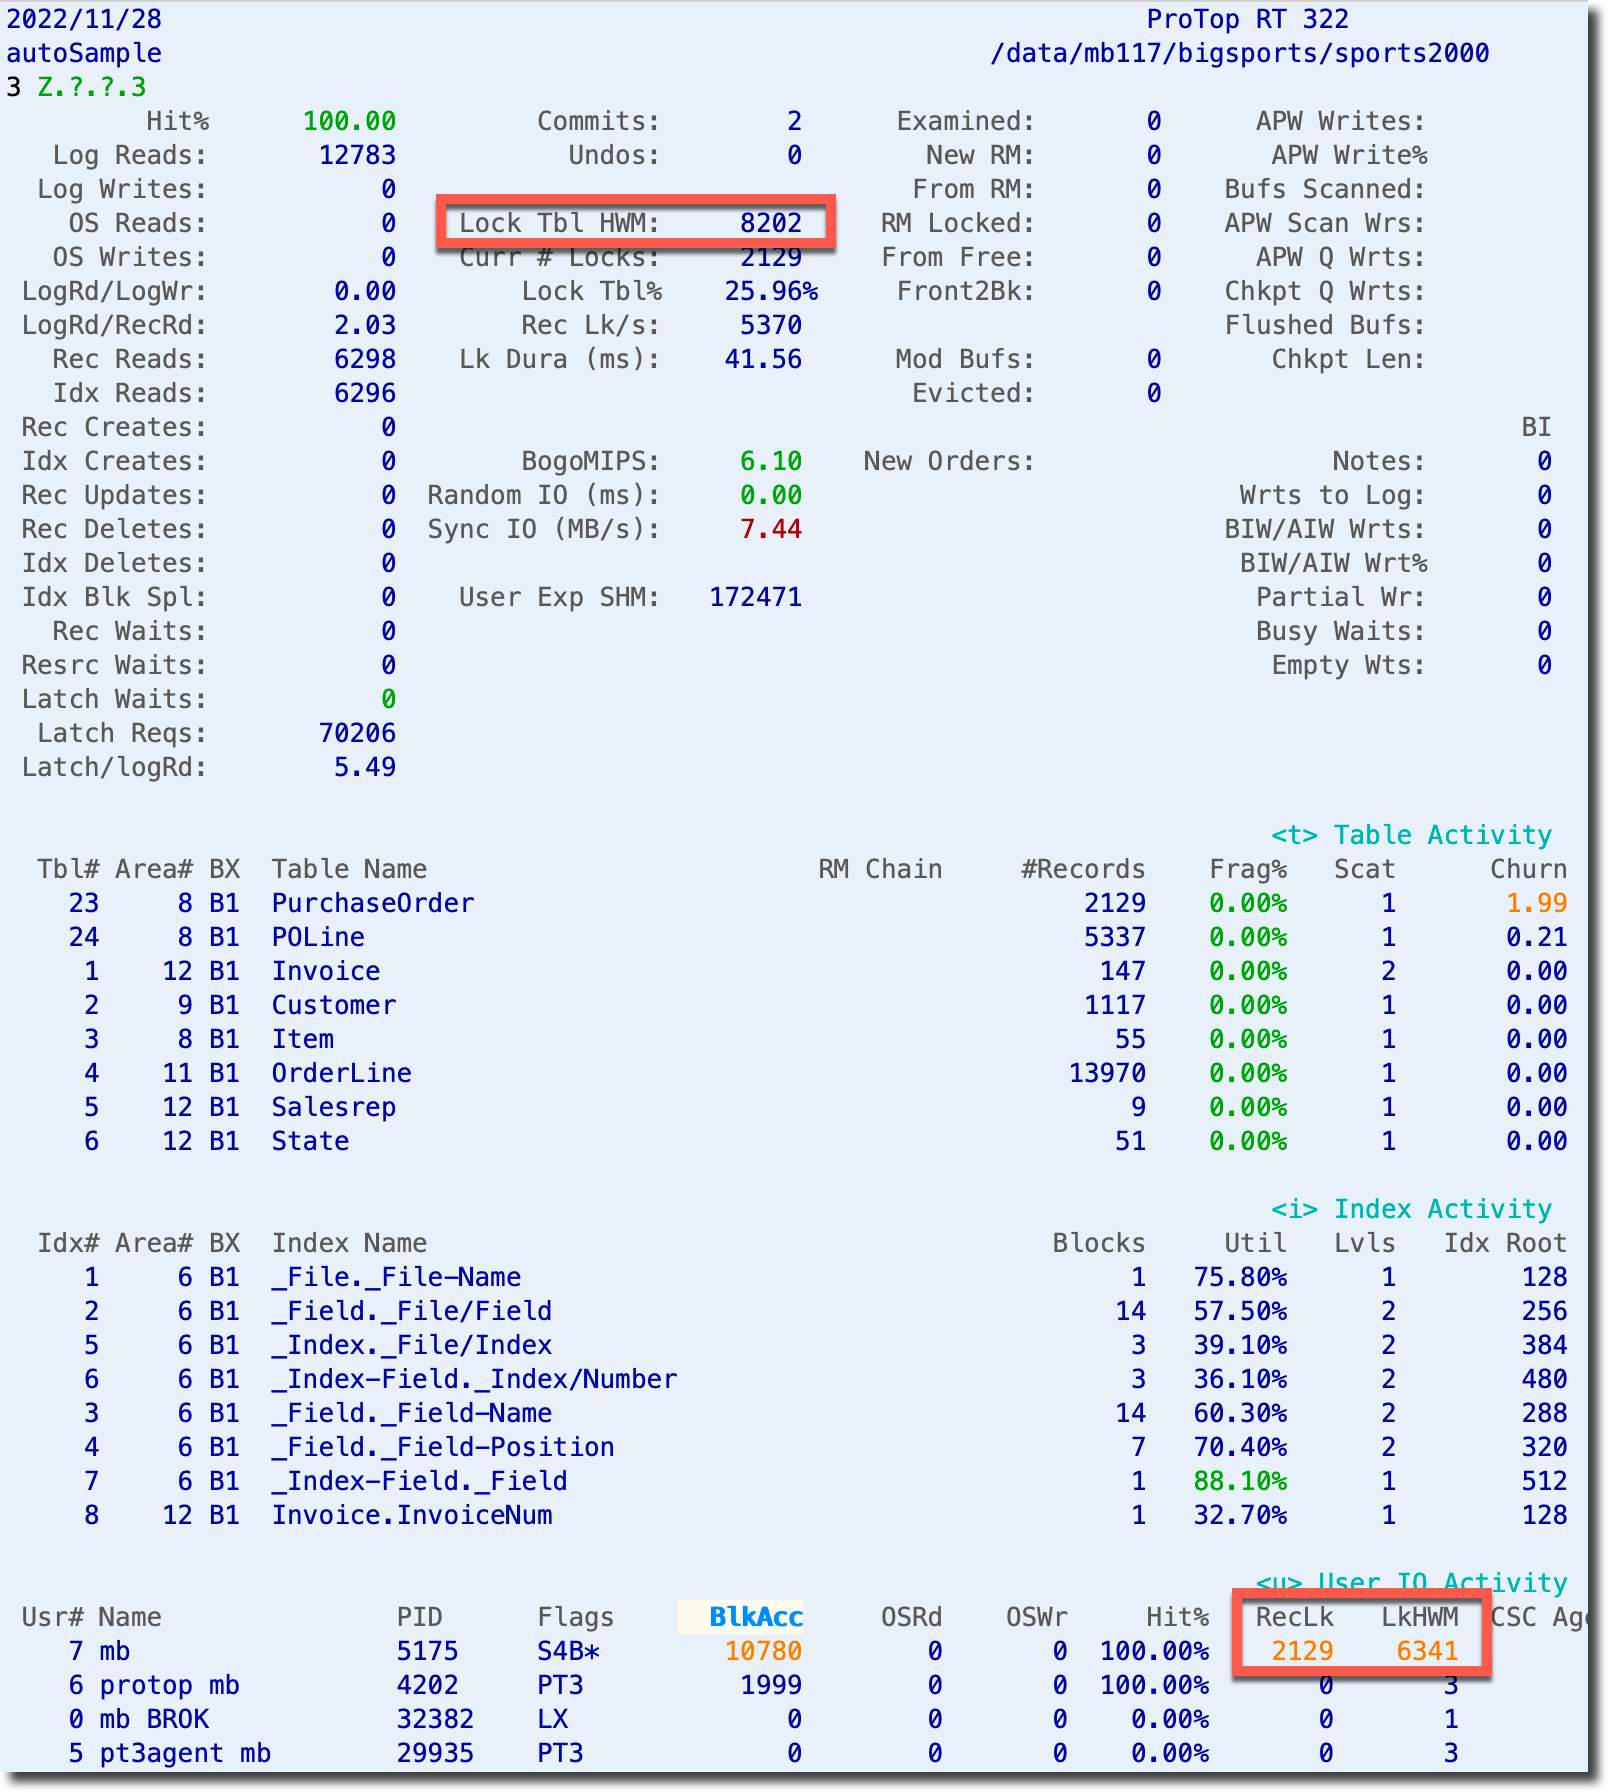
At the top, we see the database's current Lock Table High Water Mark (HWM) since the last restart. In the bottom right, we see User IO Activity, including the number of locked records (RecLk) and the user's lock high water mark (LkHWM).
This tells us immediately that Usr# 7, mb, is doing a lot of reading and locking of records in the database.
In this simple example our highest reader (BlkAcc highlighted in white above) is also our highest locker. In more complex environments, you'll want to sort this panel, based on RecLk or LkHWM as described in this article on how to Modify Sort Columns (^) in ProTop RT.
To see what code this user is running and doing all this locking, we first tell ProTop which user we are interested in by using the "#" command key. It prompts you for the user number and asks for instructions regarding the Client Statement Cache (CSC). We want to know just the procedure name and the line the code of user 7 is currently running, so:
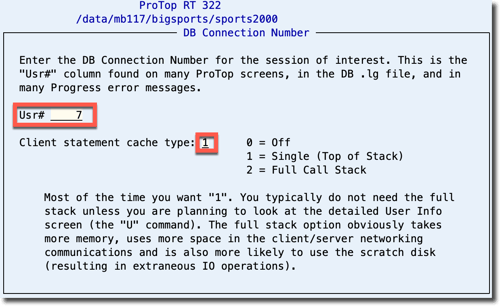
Press ctrl-x or F1 to set the user number and initiate the Client Statement Cache pull. Assuming the session is actively communicating with the database, the cache should be ready for viewing. You can see the CSC data by using the "d" command key to return to the performance dashboard and using the "u" command key to see the User IO Activity panel, which should now be displaying the cache: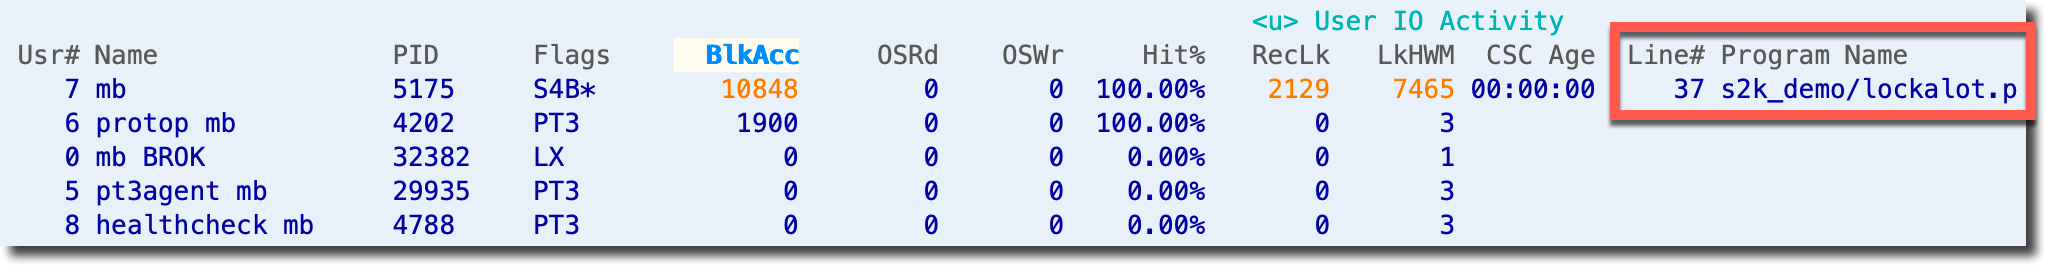
You can also use the "U" command key, and you will be presented with the User Information Viewer for the user you set with "#" showing the Session 4GL Call Stack in the lower half of the screen: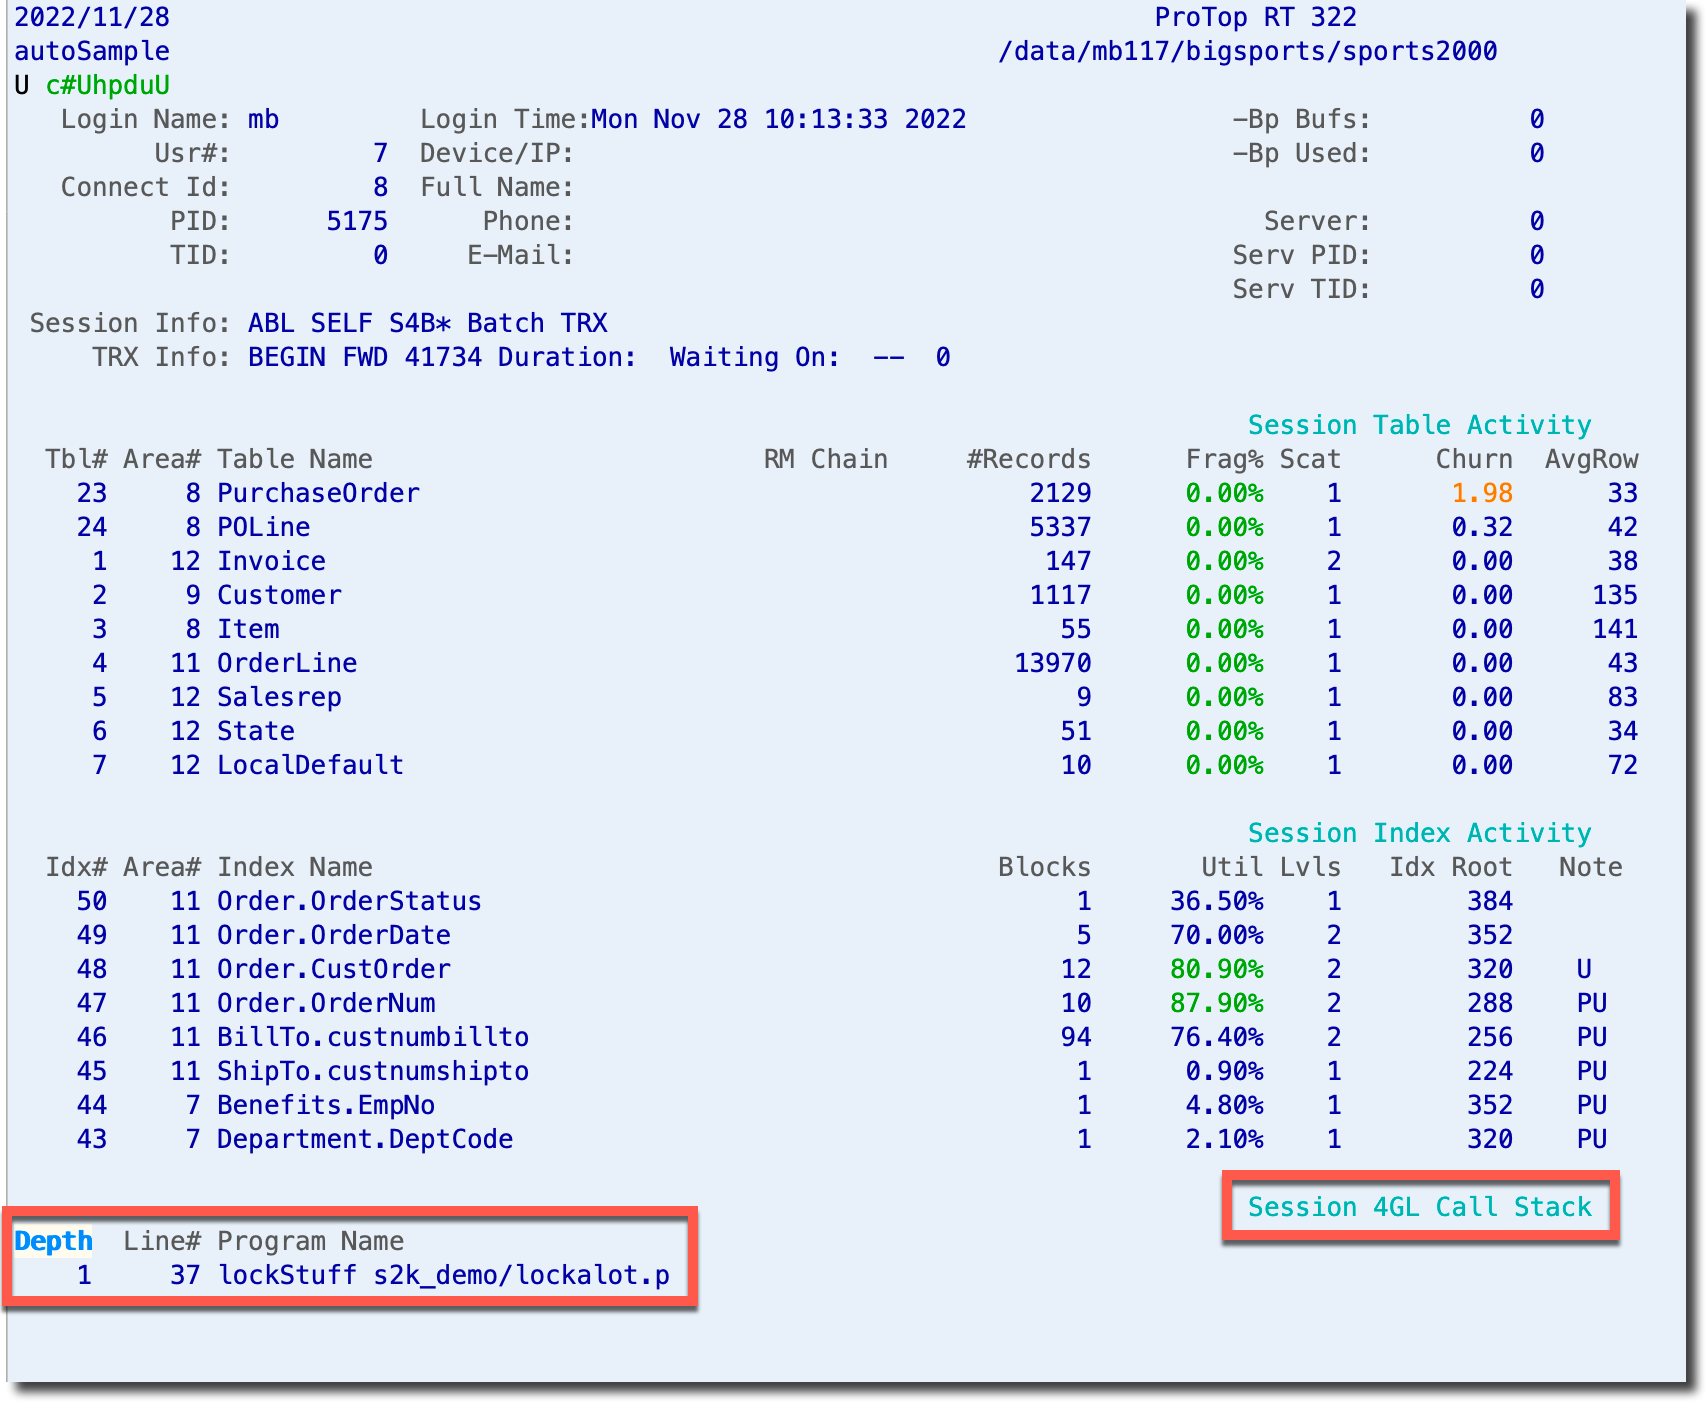
Conclusion
Now that you know the procedure and line number, you can investigate that logic and consider options for refactoring, rescheduling, etc. Please see this Progress article on debugging Lock Table Overflow for more direction.