New DBA Series: Frequently Useful Numbers

“One Size Fits ALL” may be acceptable when talking about thong sandals or knit caps (it’s not entirely true even then). However, it is an obvious mistake when talking about bicycles, swimwear, and all manner of measures used in administering OpenEdge databases. That said, below is a list of metrics that can provide properly fitted insight into your database’s operational status.
Is the DB up?
Okay, so it’s not a number or a statistic, but it is certainly the most critical question. Along with this, who do the users call first? Is it you or somebody else? Know who’s going to get the call, and be sure they can always answer that question!
Backup Age
How old is your last successful probkup? Do you know where your backup is stored? Did you restore and verify it? It’s not a valid backup until you test it!
Number of Connections
Connections <> Users <> Licenses. It’s a useful proxy for workload and often an indicator of other problems. For example, if one-third of your connections disappear, or there are suddenly two hundred more than usual, did you notice? It’s a useful number for capacity management and licensing status.
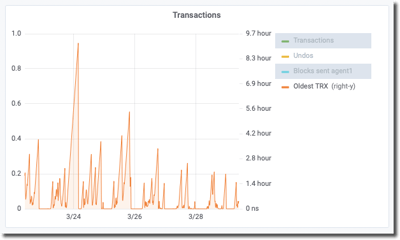
Oldest active TRX

This number may indicate abnormal BI growth – very old transactions are the *cause* and bi growth is the *symptom*. Uncontrolled BI growth can put you in a (very) difficult recovery situation. Even well-behaved applications sometimes have bugs that lead to long-running transactions.
Commits per Second
A key indicator of activity & workload. Very sensitive to IO response. Do you have a baseline? What’s normal for your system?
Logical Reads per Second
Driven by inquiries & lookups and is very sensitive to code quality. Poor index selection leads to very slow, inefficient queries and user complaints. Or it indicates a lack of appropriate indexing. It can be an indicator of inappropriate use of CAN-DO & MATCHES in your code. Why focus on logical reads and not record reads? The number of levels in an index influence the number of reads per record. The upper limit within the database engine is logical reads, not record reads. And, searching for things that aren’t there shows up as logical reads – not record reads.
Number of Full After Image Extents
Full should always be 0 or 1. If this number is greater than one, your recover-ability is potentially compromised.
Number of Locked After Image Extents
When running OE Replication, if locked extents are greater than one (OE Replication is single-threaded between the server and each target), your replication target database is not keeping up with the source database, and you should be worried, or, if you are smart, notified. This indicates the source replication server process, a target’s agent process, the network connection or configuration (pica, etc.) between them. The target database or host might be down or otherwise overtaxed or overly restricted.
Latch Timeouts
Latches are supposed to be very fast! Timeouts mean that people are waiting or that the engine is approaching a limit:
LRU – read activity may indicate table scans
BHT/BUF – read activity, the same data being read over and over and over at a very high rate
LKP – “lock purge”
MTX – microtransactions, you may have your BI or AI on RAID5 or, even worse, RAID 6
OM – object manager, your schema may have a lot of tables, indexes & LOBs
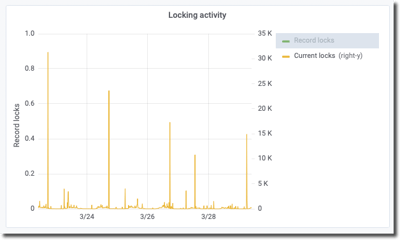
Locks in Use
How many locks does a user need? Do you know the normal number of busy users on your system at any given moment? Do you count the number of active users who are updating something vs. just inquiring? Does your lock usage grow as your data grows? Trending your locks can help inform you when something goes awry.
Blocked Users
Is the number growing? What are they waiting on? A well-written application running in a properly tuned computing environment will rarely make your users wait long enough for them to “feel” it. Users are regularly made to wait for a resource they need to complete their work, usually for only microseconds. If they are “feeling” it, waiting an unusual amount of time to accomplish their task, they are being “blocked” by some other process. Blockers can be stuck waiting on these resources, among others:
REC – a record lock; could be a deadlock or other coding issue
Sequences
BKSH, BKEX – database buffer locks
TXE – micro-transaction
STCA – statement cache
Busy Users, Tables, and Indexes
Know what is “normal” and be on the lookout for changes. Meaningful “user” names are beneficial!
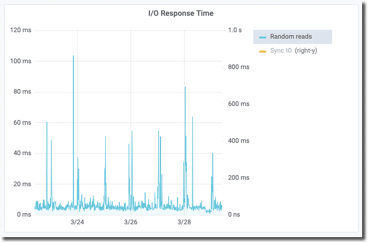
IO Response Time (random reads)
This number indicates the amount of stress on disk drives, perhaps due to other applications sharing a SAN. Even if you have low IO rates, you want to know response time. There is no such thing as a “high-performance SAN,” but 5ms is “acceptable.” On the other hand, internal disks should have response times of 2 or 3ms, and internal SSD should be 0.1ms or better. Consistency is critical!
CPU Utilization
BOGOMIPS = bogus millions of instructions per second. Circa 2016 CPUs should be four or more; circa 2021 CPUs should be around 8. Variation potentially indicates an over-committed virtual machine. Again, what is “normal?” What is %USR vs. %SYS? What about %WIO?
Disk Space
Is your disk space consumption steady for the OpenEdge disk space consumers below? Is it flat or increasing at a known rate? It should be sufficiently predictable to leave you time to add space before you run out, given the hurdles to doing so in your environment. Are you watching it?
- BI & AI
- Application Data and Index extents
- -T space or user’s home directories
- Archived after-image logs
- Backups
- Application and Database Log files
- Application Exports and Reports
- etcetera
Your Numbers are Useful, Use them, Frequently!
While most of these metrics exist for all OpenEdge installations (older versions notwithstanding), only your actual numbers can inform your unique operational constraints. Know your numbers, measure and trend your metrics, alert on your measurements! There is no one-size-fits-all solution for OE databases, and there doesn’t need to be, your numbers are waiting to tell you when things no longer fit. Are you listening?


