
It's for developers too! Read on to see how ProTop can inform your development lifecycle by helping you uncover issues before they reach production. Oh, and it's free!
ProTop RT - The developer's friend
Out of the box, ProTop Real Time (aka ProTop RT) gives you immediate insight into the goings-on of any database you point it at, with no configuration required. It's free, by the way, did you know that? Install ProTop in a standalone fashion, no portal required, and run:
protop [explicit path to your database]
You will see one or two splash screens informing you of the need to provide a database analysis report (always a good idea) and or to change some table range parameters. These help ProTop evaluate the current condition of your database.
You can breeze right past these screens and jump to the main (default) ProTop RT view to see "what's going on in my test database right now when I run this piece of code?".
The dashboard section showing database performance by default is at the top of the default view in ProTop RT. Items to pay attention to are highlighted. The lower half of the screen shows three panels: <t> Table Activity, <i> Index Activity, and <u> User IO Activity, showing the most active entities listed in descending order:
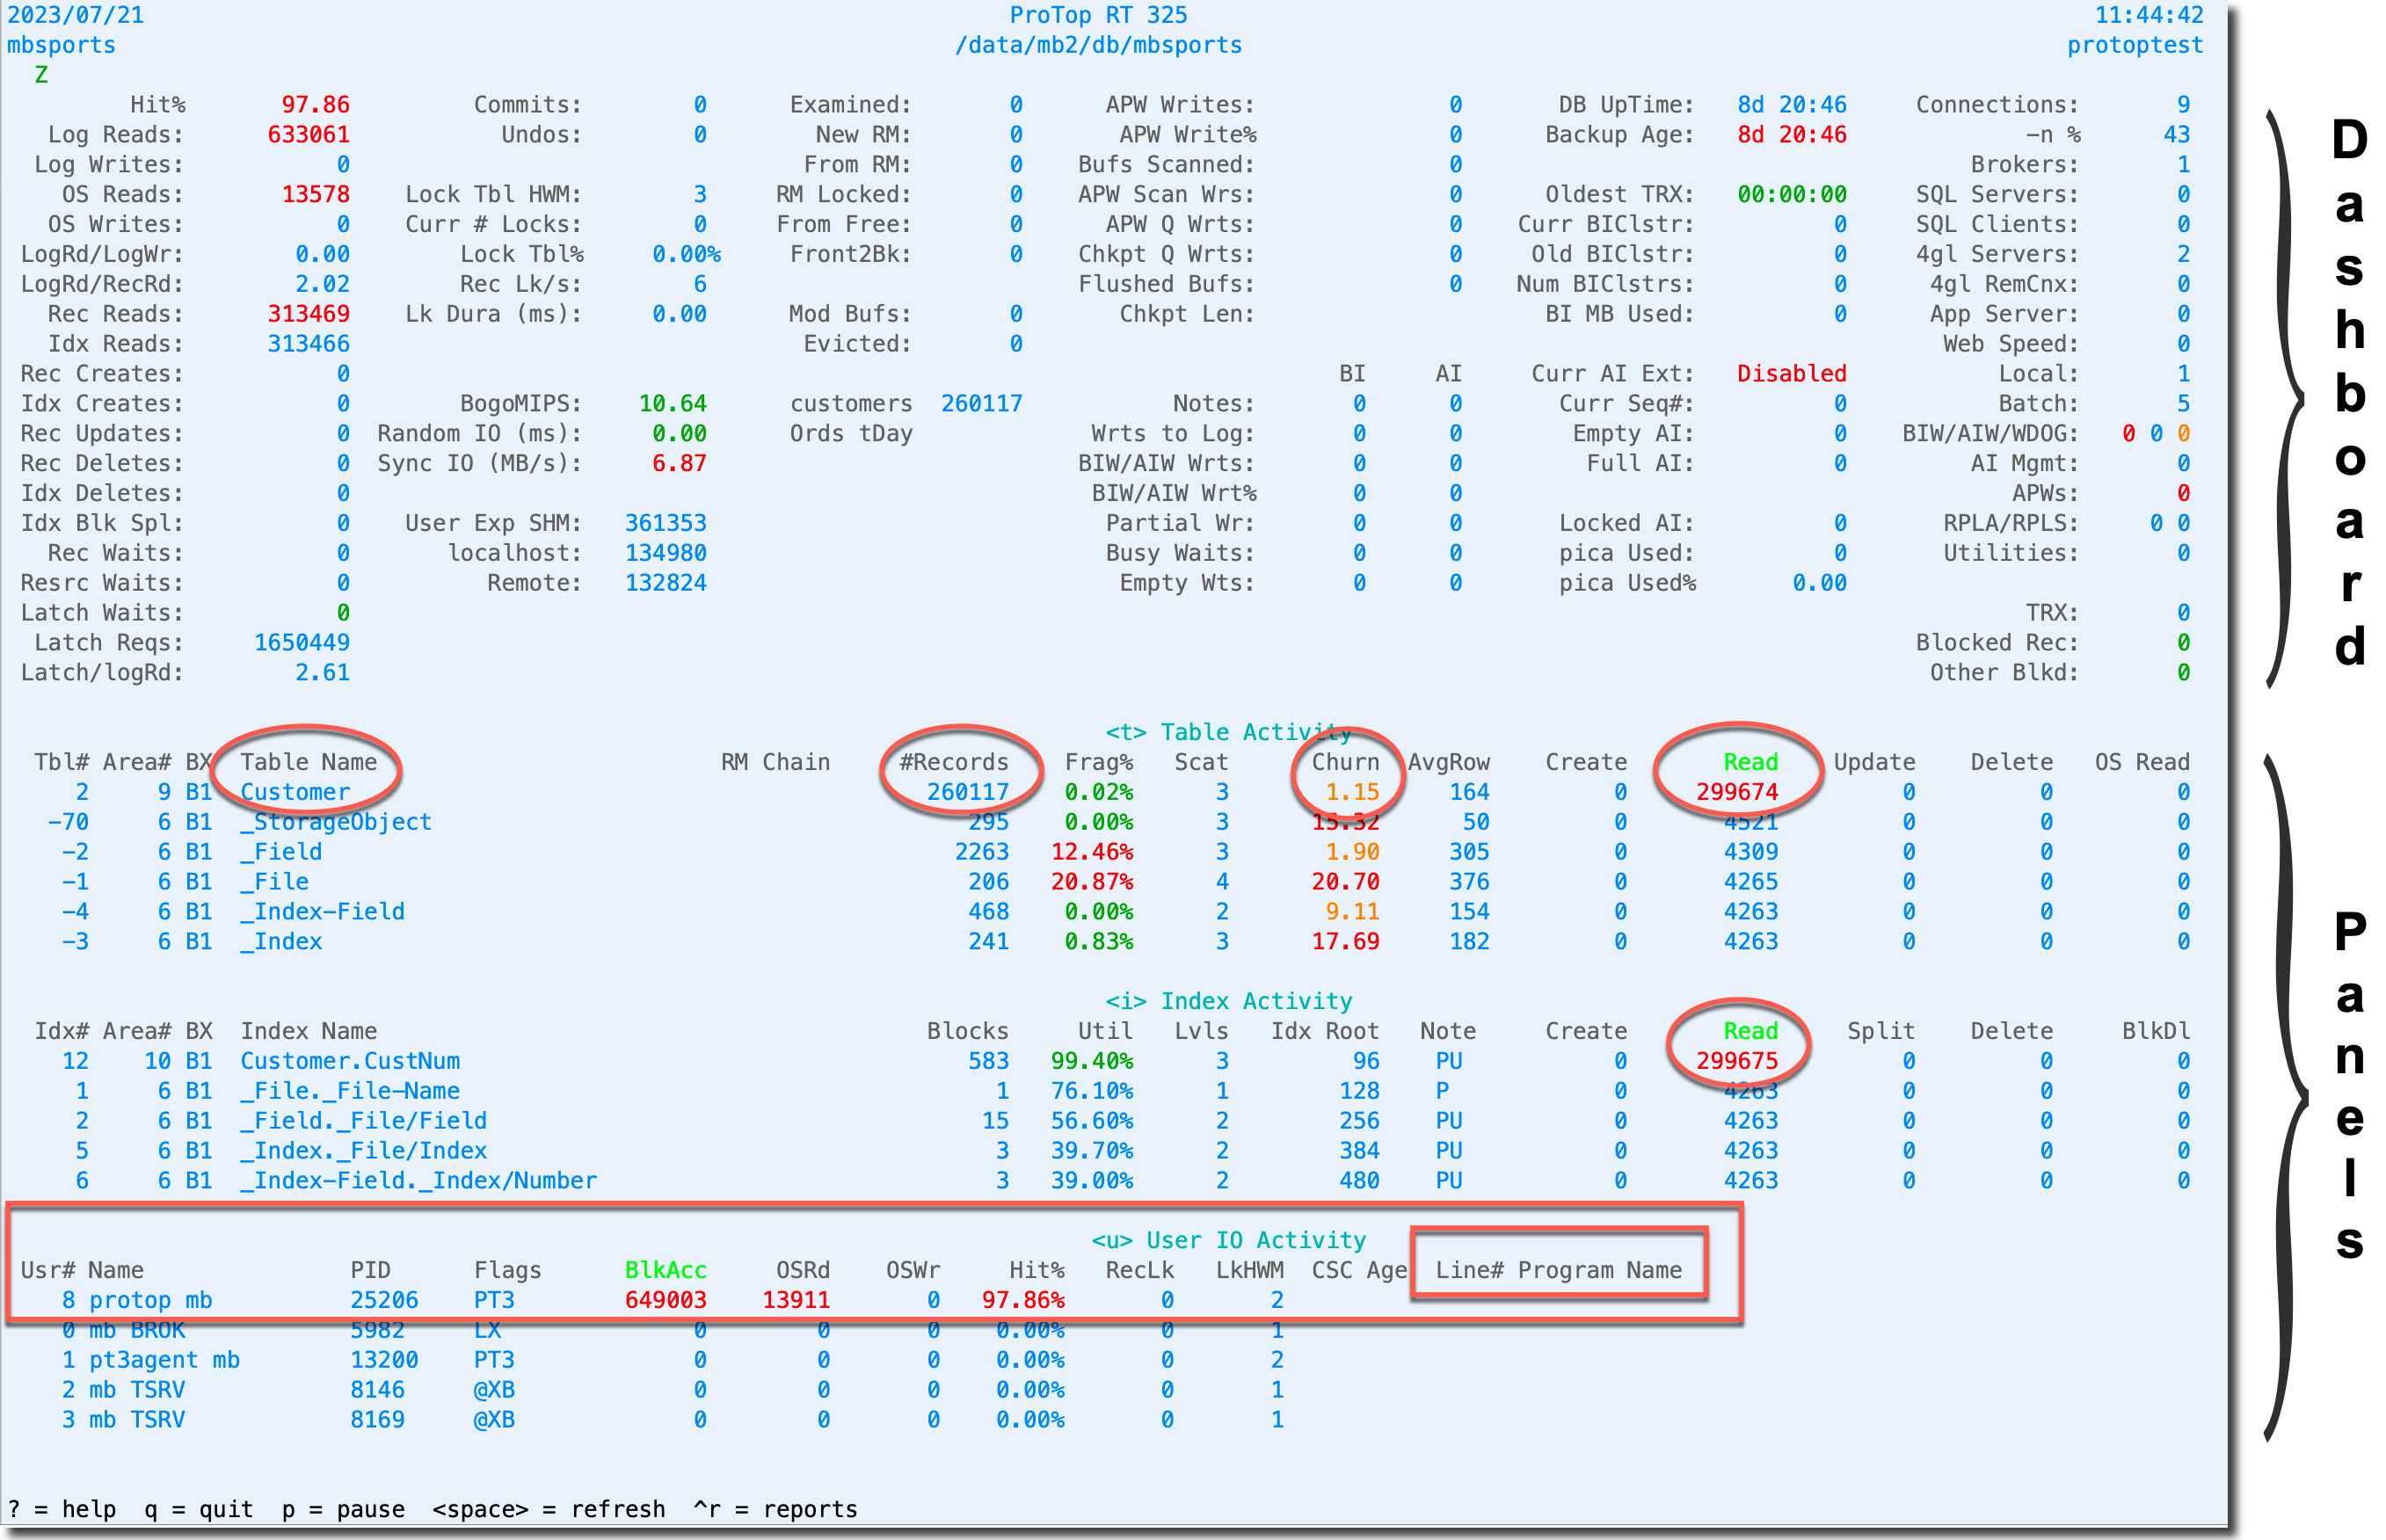
Here we immediately see the customer table and customer number index being hit pretty hard. Notice "Churn" (the third circle); this is the number of times the equivalent of the entire table is being read per second (1.15 times in this case). Ouch! Who is doing that!?!
Jump to the red boxes at the bottom of the screen, and ProTop RT shows you who is doing the most reads. Some chap named "protop mb" is doing all those reads, that's who!
But what code is he running that's causing all these reads? We can't tell yet, but wait; ProTop can provide you with a stack trace, also known as the client statement cache (CSC). Read this article on Finding Code: Excessive Reads in the ProTop Help site for the details.
Have a look at these articles as well on finding code for different common issues:
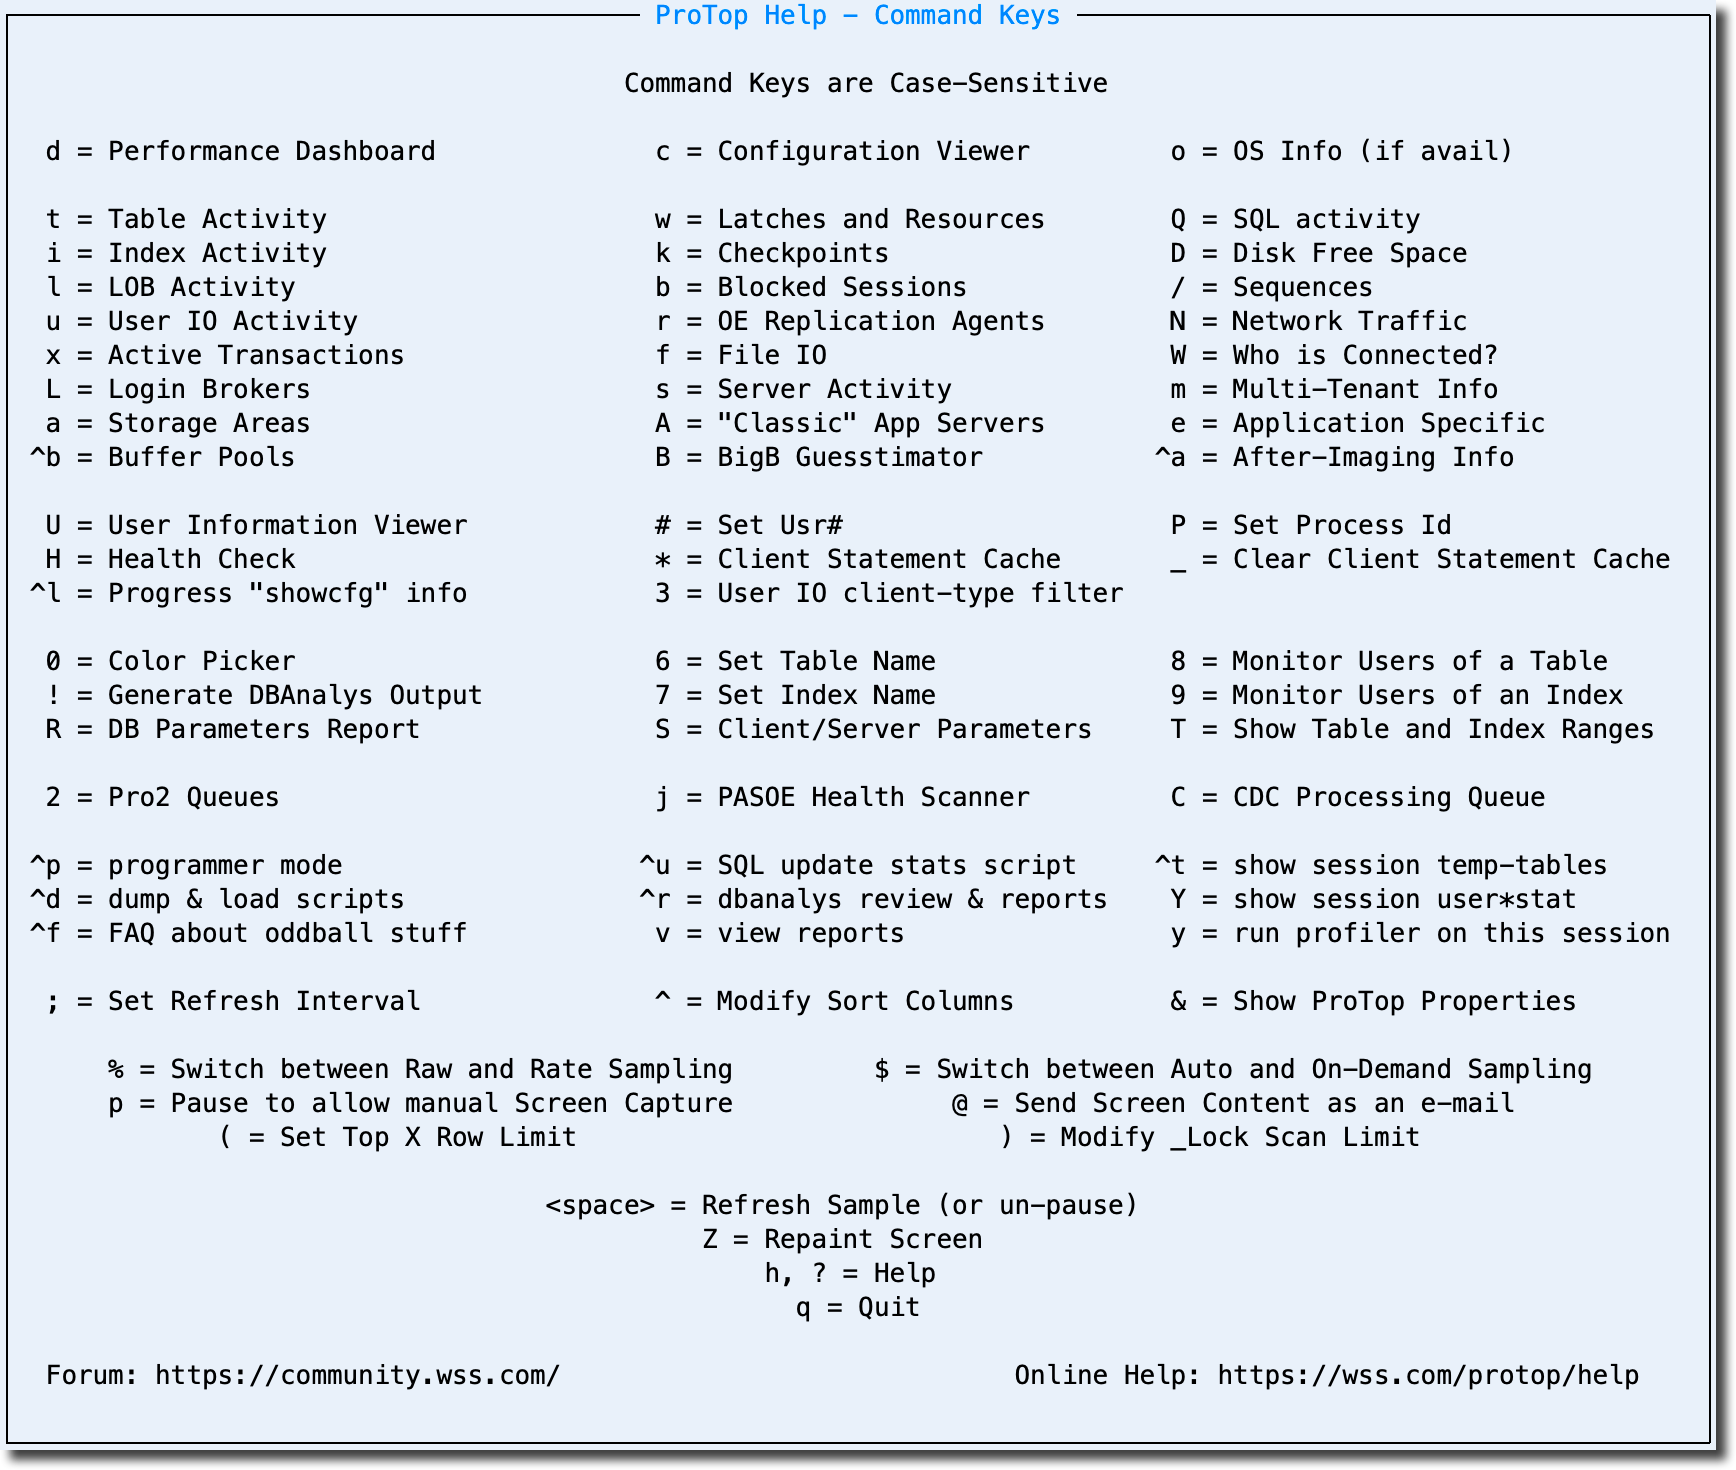
ProTop RT - Help Screen
Use the help screen (press h or ?) to see all the available dashboards (first row) and command keys. Press the key to show a dashboard or panel, and press the key again to hide it:
ProTop for Developers - some code...
There are also various bits of sample code distributed with ProTop with the intent of helping developers to instrument their code better. To see the unencrypted version of this code, create a directory (e.g., $PROTOP/src) and unpack $PROTOP/protop-*-src.zip into it. Then go to the lib directory there to find:
- lib/zprofiler.p -use the Progress profiler to help debug performance issues
- lib/ttinfo.p - show some helpful information about this session's temp-tables
- lib/usertablestats.p - track userTableStats for the current session
- lib/showustats.p - gather user table and index stats from within a running session
If that's not enough, check out these presentations
And last but not least...
Have a gander at this YouTube video: The Coders are Out to Get You! by Tom Bascom, the mind behind ProTop, as he walks through common pitfalls of coding with OpenEdge and points out how to use ProTop to discover and deal with those issues.
Here is the presentation slide deck for The Coders are Out to Get You! (pdf)
Conclusion
In case you hadn't noticed, ProTop Real-Time (and the ProTop Portal) is a potent tool for Monitoring, Alerting, and Trending the performance of your OpenEdge database applications. Yes, even in your development, QA, and performance testing environments!
But it is also so much more! It is a broad and deep spyglass into the inner workings of your database AND the effect your code has on it. Don't make the mistake of thinking it's just for DBAs. Use it to prevent the need for your DBA to come to find you!