
Three customers: two new, one existing. Same problem: my OpenEdge environment is SLOW! They had been searching for the root cause and running out of ideas, so they called for help.
Case #1
3 weeks ago we received a call from a company having performance issues following a double update: Progress OpenEdge 11.6 to 11.7.9, Windows 2016 to Windows 2019. Ok… this is quite straightforward, what’s the problem? Everything is slower since the update. A report takes 5 to 6 minutes instead of 2.
Not a major update
How could a simple update of OpenEdge and Windows affect performance this much? To add to the confusion, before going live with this new system – they tested it with success. There must be something else… but what?
Quick description of the Environment: VMWare hosted DB server (8 x Intel Xeon Gold 6130 @ 2.0458984375 GHz • 16.00 GB • Win Server 2019) and Terminal Server for remote warehouses linked by fiber-optic LAN. 99% of the activities are in Client/Server. They still have the old 2016 VM snapshot we can compare with.
They tried to add more memory (from 8 to 16GB) to Windows thinking Windows 2019 might be more memory-consuming. Then they tried to increase the -B parameter from 1,000,000 to 1,500,000 with no significant improvement. The application was still slow and they have no idea what the problem was.
Unless we can identify the problem, they are seriously thinking about going back to the old VM.
Recording statistics
The first thing we did was to install and configure ProTop to record as many statistics as possible for Progress OpenEdge and the operating system.
After a few hours of data gathering, there was no smoking gun. All the ProTop graphs showed normal trends. On the OS side, user CPU was below 5% average, memory and disk I/O trends showed good numbers…
Database I/O graphs
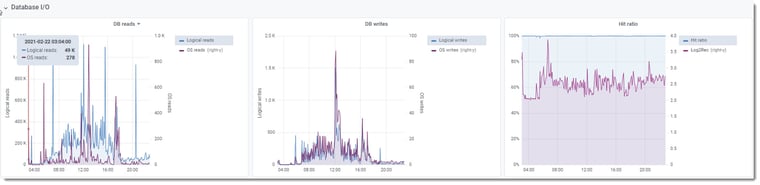
DB reads, writes and hit ratio did not display an excessive amount of I/O. The numbers correlated to the type of usage they should have.
Record Activities graphs
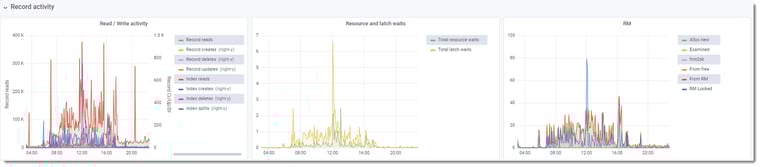
Records read/write activities were below 100K/sec on average, and resource waits, latch waits and RM activity were showing small numbers – there was no reason why the system should be this slow. These low numbers confirmed what we see on the OS side: practically no CPU usage, and practically no disk activities.
The customer was convinced that it was either Windows or OpenEdge or both. We were convinced that the issue was external from this VM because ProTop was not showing any suspicious trends. While gathering the statistics, we suggested doing tests from different configurations (Shared memory, localhost, client/server).
The system is running fine…somewhere (!?)
While configuring everything for the User Experience tests, one of the warehouses reported that they didn’t see much difference since the new server was put in place. Wait what? The IT department decided to look away from the new VM and OpenEdge and started to investigate what is different between this particular warehouse and the other ones. It turns out that this warehouse was using a different switch. A HA !! While we didn’t get a chance to enable the relevant data collector, we know that ProTop’s User Experience Client-Server metric was designed to catch this exact anomaly.
Guilty!
Not long after that, they identified weird error messages from a network switch. A closer look at the log indicated that a port connector for the fiber optic was defective. Once replaced – everything was back to normal.
Case #2
A week later, a call from another customer: it’s 9:45 AM, the business just started and the users are complaining about the response time.
The good news is that this time we had ProTop historical trend data.
What’s in ProTop?
A quick look at database trends showed normal behavior and eliminated the usual suspects (runaway processes, blocked clients…), except for the I/O Response time. Unusual Sync IO trends started ~8:30 PM the day before.
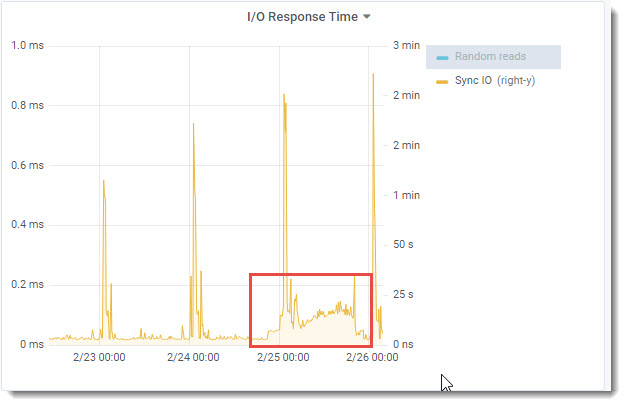
SyncIO: The ProTop syncIO metric measures unbuffered disk write performance by timing the execution of a bigrow of a 96MB file. It uses the same mechanism the database uses to write AI and BI notes to the after-image and before-image files.
A quick check with the customer: are you aware of any infrastructure issues or other events?
A call to the hosting company revealed that they were performing a backup before a VCenter update. This was using most of the bandwidth for the disks, resulting in a slower response time for the OpenEdge environment. As soon as the backup finished, everything was back to normal.
Case #3
This time it’s an email from another part of the globe. The problem is the same, though: awful performance.
It’s a Windows environment, common application, normal-sized enterprise but very very bad performance. OpenEdge metrics are not displaying bottlenecks anywhere. If they restart the OpenEdge environment (dbs, appservers, etc.) it runs ok for a while but performance decreases with the number of users connecting to the environment.
Recording statistics
Again, the first thing we did was to install and configure ProTop to record as many statistics as possible for Progress OpenEdge and the operating system.
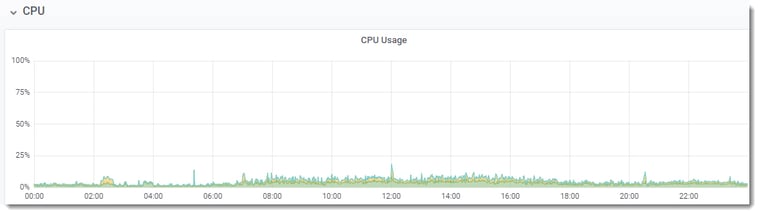
As it doesn’t look like anything was wrong with the OpenEdge environment, we had a look at system trend data: CPU, memory, and disks…. HOLY SMOKE!!
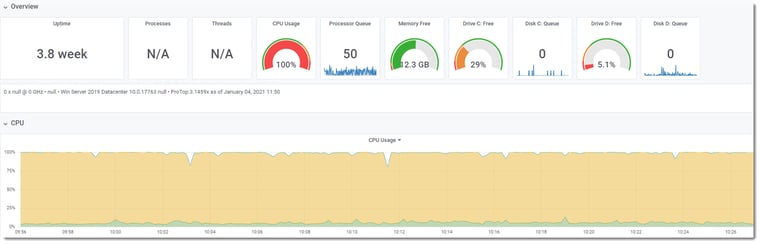
The CPUs are smoking – what is using so much CPU!?!
Keep a safe distance, wear a mask and eye protection
Once the source of the smoke was identified they started to fix the problem:
- Disable Windows Defender virus scanner on the DB Server
- Tweaking SentinelOne virus scanner on…. the DB Server
Yes you are reading this correctly. Two virus scanners on the production server.
The customer mentioned that Windows Defender was claiming ~30% of the CPU just for itself. Imagine the amount of CPU left for the database & users.
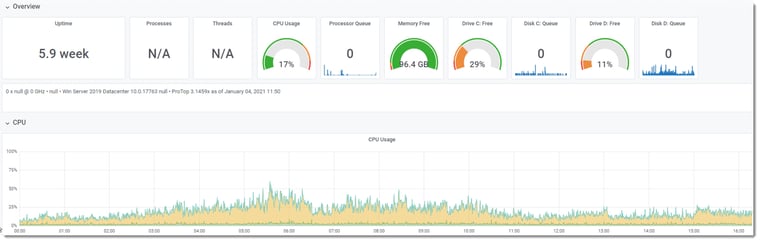
After the fix
Historical trend data
These 3 similar cases show the importance of having historical trend data. In the first case, we had to gather a certain amount of statistics before having an idea of the “normal” activity level of the databases. If we had to run the different tests and compared them with the old VM we would have ended up with the same result or better performance on the new server. With historical data, we could have quickly identified that the OpenEdge environment was running normally and that the problem was likely external, saving significant time and effort. That is exactly what we were able to quickly identify with the second case! In the third case, ProTop showed again that the OpenEdge environment wasn’t the root cause of the performance issue.
Even if you don’t have any issues with your OpenEdge environment, historical trend data is invaluable when you need to quickly identify a problem. Start recording today!