
Welcome to our monthly ProTop newsletter, where you’ll find out what’s new, tips and tricks and other cool ways to use both the free and commercial versions of ProTop.
In this month’s issue we want to dive into the data: what do some of these data points mean and why should you care?
Main Dashboard
Unless you customize the startup screen through the XSTRASTART parameter, ProTop always starts with the dashboard view of data.
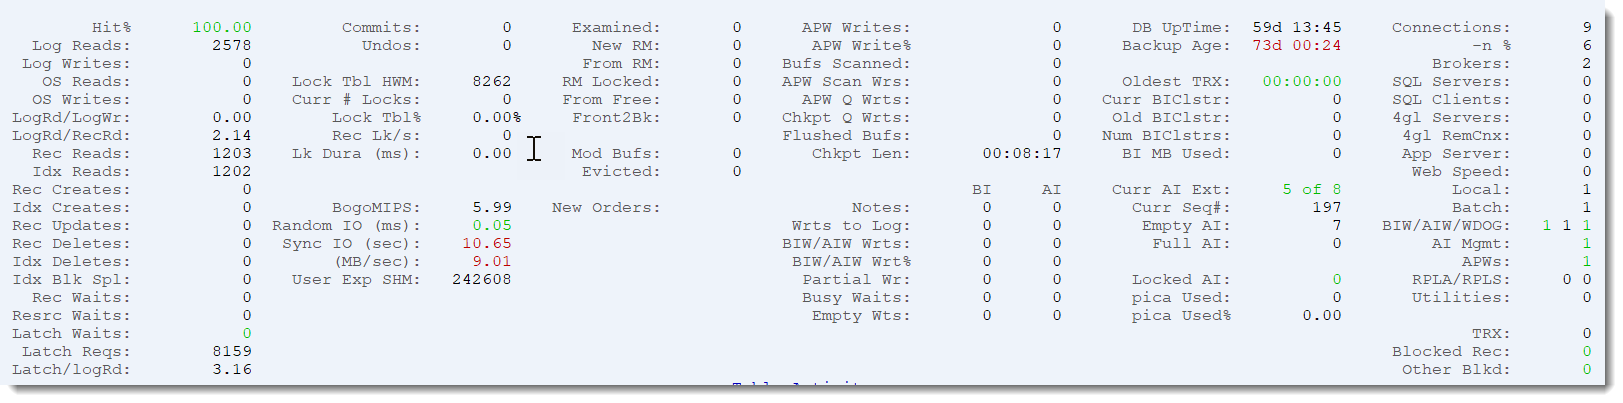
At first blush, you might want to compare it to the Activity screen in promon, but that would be…inadequate. Like comparing a Toyota Corolla, which is an excellent car and one of the most popular in the world, to a Mercedes AMG E63 S. Both will get you to the grocery store eventually, but that’s where the comparison ends.
For example, contrary to promon, ProTop RT, by default, converts data to a “per-second” rate and samples every 10 seconds. What you see is what is happening right now, not an average over the last week or month since the database was started.
Activity
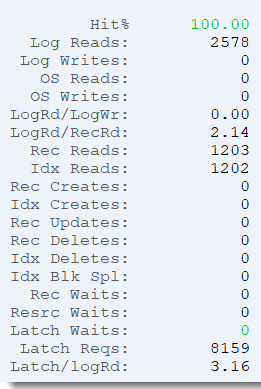
The first column shows database activity. Pretty cool – everyone knows the “hit %” metric (Percentage of database reads read from the database buffer cache), but understanding the actual number of logical and operating system reads is crucial. Do those numbers make sense to you? If you have a 50-user OpenEdge environment for your business, does it make sense to you that they are reading the database a million times per second? I agree that getting 99.999% buffer hit percentage is great, but you should question the sheer volume of activity too.
Same thing for the ratio of logical reads to record reads (logRd/RecRd): To find data in an OpenEdge database, you typically need to read an index tree leaf to identify the ROWID, then retrieve the record. This means that the ratio of logical database reads to record reads should be a bit more than 2:1, as you need to traverse the index b-tree to get to the leaf containing the first ROWID. If this number is much higher than 2, something *interesting* is happening (hint: *interesting* to an I.T. person is rarely *interesting* to the business!).
And what about those pesky waits? Record waits, resource waits and latch waits. We absolutely want those to be zero all the time, and if not, ProTop can help you drill down to locate the root cause. We’ll talk about those screens in a later blog post, but if you just can’t wait, read the Latches and Resources page.
BogoMIPS, IO and User Experience
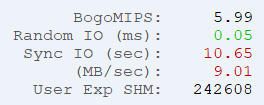
What in the world are these metrics !?! At a high level, these represent single-threaded CPU performance and disk IO performance as seen by the OpenEdge AVM.
BogoMIPS is the measure of single-threaded performance when running 4GL code. Higher numbers are better. Values of 6 and up mean the server is running on modern Intel Xeon CPUs or comparable (as of 2021) , 4-6 are older CPUs. Anything under 4 is old and slow.
We also expect the value to be consistent: if it’s 5.2, then it should be around 5.2 all the time. If you see wild swings in bogoMIPS then it could be an indicator that your CPUs are over-burdened. If top/topas/nmon/glance (UNIX) or Performance Monitor (Windows) insists that your server is not using a lot of CPU, then a wildly varying bogoMIPS could point to an overprovisioned hypervisor.
SyncIO is the time it takes to format 6 x 16 MB = 96 MB of BI clusters. This is a great proxy for understanding the unbuffered write requirements of the databases AI and BI subsystem. Numbers greater than 10 seconds are concerning.
Why is this important? When the BI needs to grow, it grows by one cluster (see proutil db -C truncate bi for instructions on how to set the cluster size). If your BI cluster size is 32 MB, and your syncIO time is 10 seconds (meaning 9.6 MB/second), then it’s going to take around 3.5 seconds to format that cluster, during which time, writes to your database will be paused. I’ll spare you the suspense: that’s bad. Our rule of thumb is 2 seconds max before this happens:
Now maybe your BI cluster size is too big, and we’ll dive into that topic when we discuss checkpoints, but more likely your disks are simply too slow for the workload.
SyncIO Numbers
I know you’re going to ask: how fast is fast and how slow is slow? Let’s turn to our friendly neighbourhood curmudgeon, Tom Bascom, for the answer:
10 sec = pathetic, where did you get this junk? a 5.25″ floppy disk would probably be an improvement.
9 sec = 10MB/sec — barely acceptable, but your users are probably plotting an uprising.
5 sec = 20MB/sec — you should be looking for better storage, there are lots of inexpensive options that will beat this turkey.
3 sec = 30MB/sec — meh, ok, you don’t need to throw the storage subsystem into a dumpster quite yet. but start thinking about it.
1 sec = 100MB/sec — excellent!
What’s next?
With over 50 panels and 1000 metrics, ProTop RT packs a lot of value into a small, free package. We barely scratched the surface here, but we’ll be drilling down into each of these panels and discussing the metrics that you need to understand to support your OpenEdge-based systems!
Would you like to suggest a cool new feature for ProTop? Have any questions or comments? Head over to our community page at https://community.wss.com.
Interested in learning more about the free ProTop RT (Real-Time)? The help pages at https://pt3help.wss.com contained detailed instructions on how to install and configure ProTop RT.
Intrigued by the monitoring and alerting aspect of ProTop? Install the free version first, then reach out to us to activate a free trial and show you around the commercial features.
Want to learn more about being an OpenEdge DBA? Sign up to get all our blogs and updates in your inbox and subscribe to our YouTube page.