
Welcome to our monthly ProTop newsletter, where you’ll find out what’s new, tips and tricks and other cool ways to use both the free and commercial versions of ProTop.
In this month’s issue: leveraging ProTop for your morning check-up routine.
Morning check-up routine? What’s that?
If you are responsible for I.T. systems, you likely start your day with a quick overview of what happened overnight and whether the current state is in need of any attention. Most people automate the task through some kind of review email with a few key KPIs (Key Performance Indicators). Others get fancy and include graphs and charts. Either way, it should be fast and easy, otherwise you simply will not do it consistently, or you’ll tell yourself that you’ll “check it later”… and next thing you know it’s 17:30 and you’re late to go pick up your kids.
ProTop, whether the free or commercial version, makes it super easy and automates this task for you.
What should I look for?
Here is a non-exhaustive list of things that should be in your morning check-up:
- Was last night’s backup successful?
- Are all after-image (AI) files empty except the one busy file? A very short-lived full and/or locked file is also acceptable as it takes some time to archive it.
- What is the status of OpenEdge Replication? Check both source and target(s) using the “dsrutil” command.
- Are there any long running transactions? Were there any overnight?
- Were there any crazy overnight spikes in system or databases metrics? For example, massive reads and/or writes from an inefficient batch job. Or heavy CPU usage overnight.
- Are there any unusual database log file messages, for example “SYSTEM ERROR”?
- Are there any disk free space issues? Also check for any surprise changes in usage: did something grow abnormally overnight?
Built-in and free with ProTop
We give all this away for free, and so much more really, with ProTop. We are not shy about how amazing it is to get proactive alerts (and so much more) with the commercial version of ProTop, but the free version is pretty darn amazing.
The Alerts Dashboard
Starting with version 4 of the ProTop Web Portal (available summer 2021), alerts are visible in the Alerts Dashboard in both the free and commercial versions of ProTop. Alerts older than 4 hours are masked in the free version, but you still get an incredible single-pane-of-glass view of the status of your system.
In the Alerts Dashboard screen capture below, we see that there seems to be a problem with the AI Archiver as there are zero empty AI extents available. While the commercial version of ProTop would have proactively notified you of this issue, the information is nonetheless visible with the free version.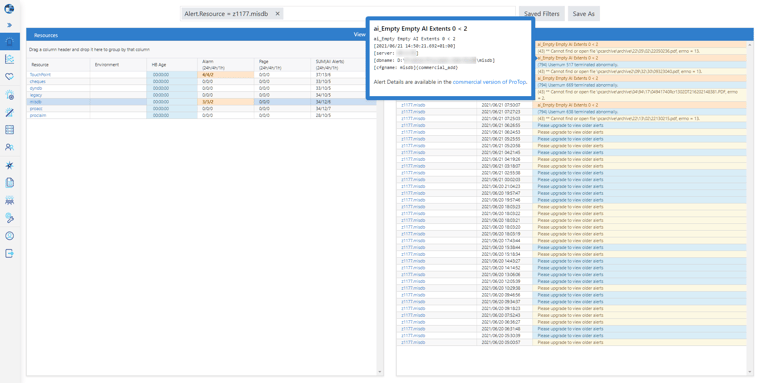
The Trends Dashboard
The ProTop Web Portal retains years of historical trend data, and the amount visible to you depends on which version of ProTop you are using. With the free level, you have up to 48 hours of historical data at your fingertips, easily showing you any interesting activity from the previous night or even weekend:
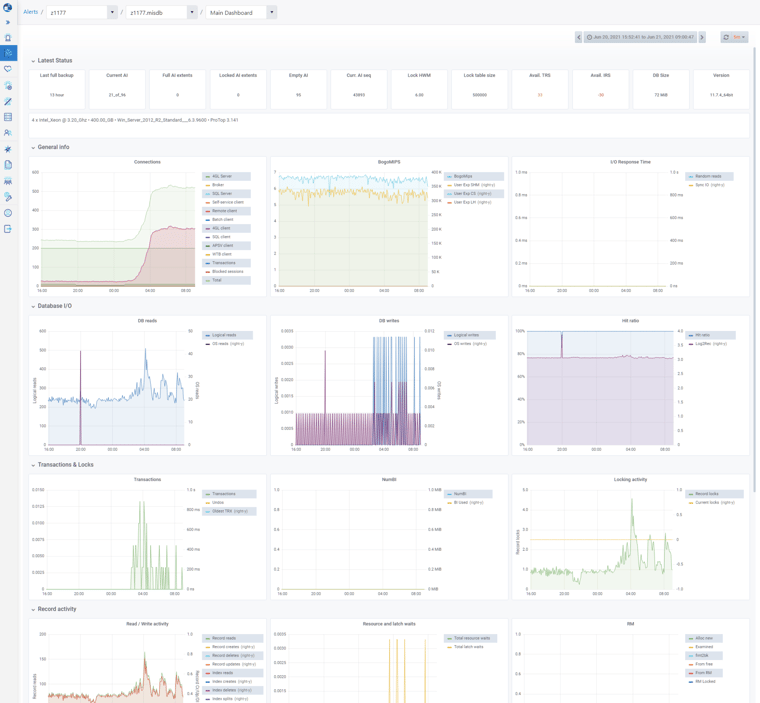
This is what we like to see: nothing abnormal from overnight activity. And if you look closely, you’ll notice that the zero empty AI issue was resolved.
The morning check-up: make it part of your routine
If you’re not doing a daily check-up, we encourage you to incorporate it into your morning routine. And with ProTop, even the free version, you have no excuse: login to the web portal, spend 1-2 minutes reviewing the Alerts and Trends Dashboards, and you’re done. And if you’d like to be proactively notified of impending issues before they affect your business critical systems, take a look at what’s included in the various commercial flavours of ProTop.
What’s next?
Would you like to suggest a cool new feature for ProTop? Have any questions or comments? Head over to our community page at https://community.wss.com.
Interested in learning more about the free ProTop RT (Real-Time)? The help pages at https://pt3help.wss.com contained detailed instructions on how to install and configure ProTop RT.
Intrigued by the monitoring and alerting aspect of ProTop? Install the free version first, then reach out to us to activate a free trial and show you around the commercial features.
Want to learn more about being an OpenEdge DBA? Sign up to get all our blogs and updates in your inbox and subscribe to our YouTube page.