
Welcome to our monthly ProTop newsletter, where you’ll find out what’s new, tips and tricks and other cool ways to use both the free and commercial versions of ProTop.
Last month we showed you the dashboard view in ProTop RT. In this month’s issue, let’s see what it looks like to trend that data over days, weeks, months, and even years!
ProTop Trends: The Main Dashboard
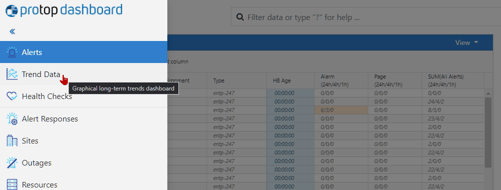
Open the sidebar menu in ProTop (new version coming Q4 2021), select “Trend Data”, and you’ll find yourself viewing today’s metrics in the “Main Dashboard”. The free version of ProTop gives you access to the last 48 hours of data, enough to see what happened last night or over the weekend, while the commercial versions offer months and years of trend history.
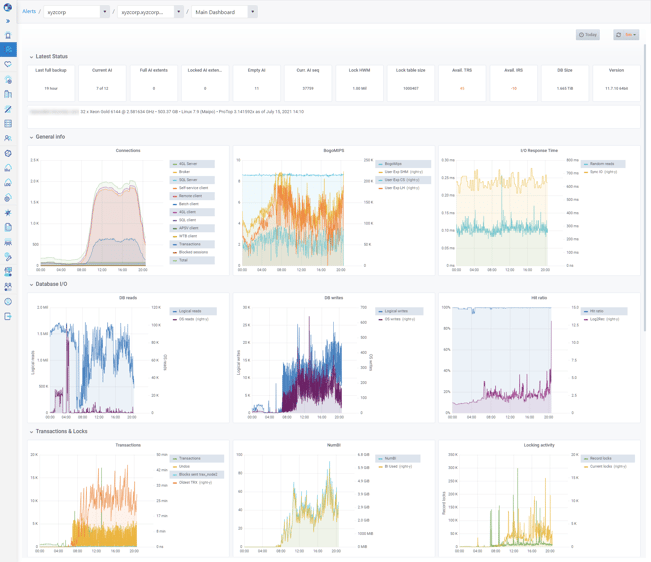
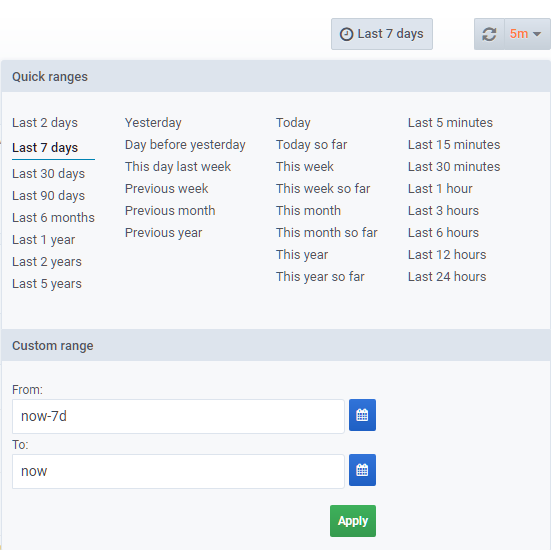
If you want to see more than just today’s data, you can zoom out by double-clicking on the graphs, or use the date picker in the upper right-hand corner.
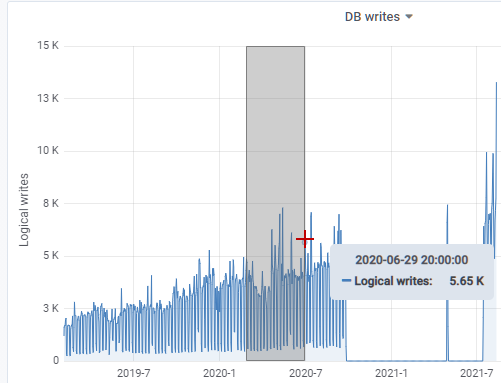
Do you see something interesting? Zoom in by simply highlighting a section of any graph with your mouse.
Ok…that’s cool, you say, but…
Who Cares?
You should care, that’s who. Below are a few quick examples. The first three show long-term trends over years, whereas the fourth shows a point-in-time change that seriously affected performance and that would have been nearly impossible to pinpoint without any trend data.
Long-Term Trends
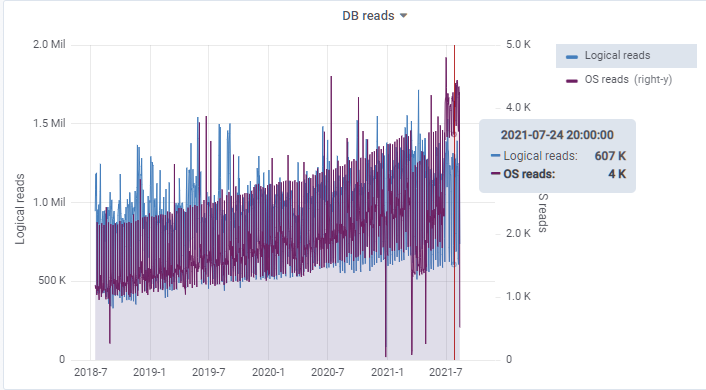
In this first graph, covering roughly 3 years of database trends, we clearly see that the business has been booming. Database reads rates have been rising steadily from roughly 900K reads/sec to over 1.5M reads/sec today. Having this data at your fingertips as you plan your infrastructure needs is critical as it allows you to estimate future requirements before committing to hardware upgrades.
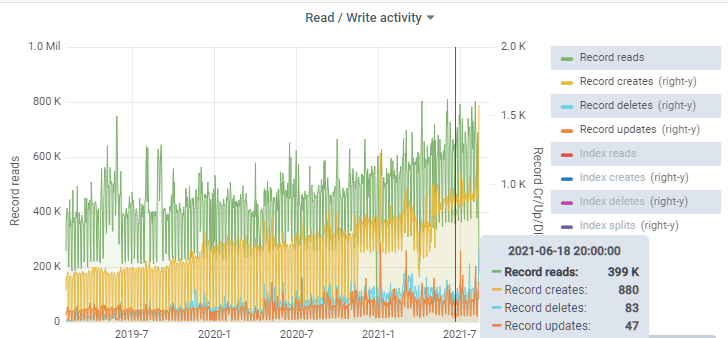
Similarly, record Create/Update/Delete activity increased over the same time period.
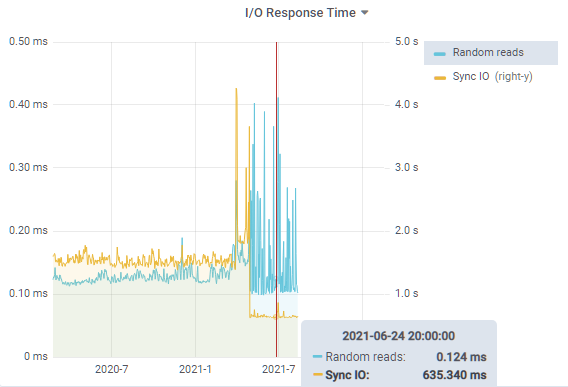
The good news is that the disk subsystem is keeping up with the load. SyncIO metrics of less than 10 seconds are considered decent (see Insights to System Metrics), and these sub-second values tell us that the server is using extremely fast local flash disks. Similarly, single millisecond random read times are pretty good, so these sub-millisecond times are excellent. You can also see that at the end of April the server was upgraded. Both Random Reads and SyncIO improved, while Random Reads became more variable (but still very, very fast) and SyncIO became more consistent.
Point-in-Time Surprises
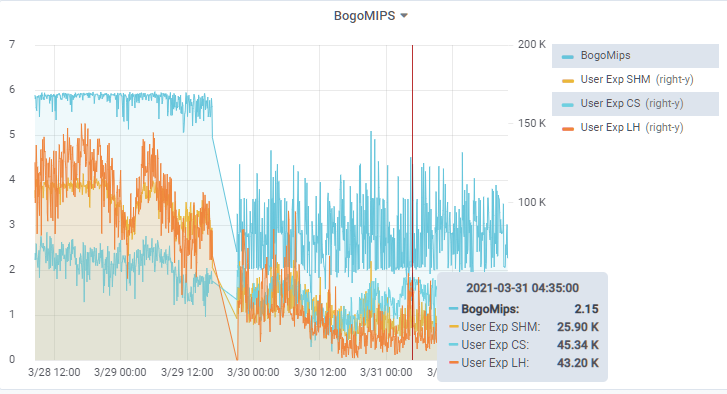
With any version of ProTop, even the free version, sudden changes in any metric are immediately apparent. Look at the bogoMIPS graph below (bogoMIPS is a measure of CPU performance, as seen through an OpenEdge lens).
What happened on March 29 at around 14:00 ? bogoMIPS performance suddenly dropped from a decent 5.8 to 2. TWO !?! My phone would register a higher bogoMIPS value!
So again, what happened? Well, I can tell you that if you didn’t have ProTop historical trend data, you might still be looking, because the operating system graphs showed an increase in CPU usage, but no indication as to why that might have happened. The logical answer would have been that there was an increase in application load, but we knew that wasn’t true. The sysadmins couldn’t see anything abnormal, but nonetheless everything was insanely slow.
TELL US ! WHAT HAPPENED !?! In case you missed it, we wrote about this situation in depth in our blog post bogoMIPS Saves the Day!
So Much More…
In this blog post, we showed you four graphs trending data for around 16 metrics. The ProTop Trends Main Dashboard has 18 graphs trending nearly 100 different metrics. We’ll deep dive into more graphs, more metrics and more dashboards in upcoming ProTop newsletters.
In the meanwhile, let us know which metrics are important to you.
What’s next?
Would you like to suggest a cool new feature for ProTop? Have any questions or comments? Head over to our community page at https://community.wss.com.
Interested in learning more about the free ProTop RT (Real-Time)? The help pages at https://pt3help.wss.com contained detailed instructions on how to install and configure ProTop RT.
Intrigued by the monitoring and alerting aspect of ProTop? Install the free version first, then reach out to us to activate a free trial and show you around the commercial features.
Want to learn more about being an OpenEdge DBA? Sign up to get all our blogs and updates in your inbox and subscribe to our YouTube page.