Welcome to our monthly ProTop newsletter, where you’ll find out what’s new, tips and tricks and other cool ways to use both the free and commercial versions of ProTop.
Many of you have some kind of operating system monitoring in place. But ProTop monitors system resources like CPU, disk and network from a uniquely OpenEdge perspective.
An OpenEdge Perspective?
Yes. And it’s free.
ProTop is installed on hundreds of servers around the world, monitoring thousands of databases (over 3,000 at last count). With all of that data, we have the ability to see interesting correlations and synthesize new metrics and alerts to protect ProTop-monitored systems. Some of these are “system metrics” rather than “database metrics”, but as seen through the lens of the OpenEdge AVM (ABL Virtual Machine).
With the proliferation of virtualization at the compute, storage and network layers, combined with segregation and specialization of the associated sysadmin roles, we often see our customers fall into a trap where all of the technical staff and vendors insist that their technology silo is working just fine while users howl because of the horrendous performance. Something isn’t working, but nobody sees any problems.
Then along comes ProTop. ProTop reports performance from an end-to-end perspective as the user of an OpenEdge application sees things. Not as the administrator of a silo sees things. This enables the business users to provide measurable feedback to the various technical parties and keep everyone focused on improving the user experience rather than siloed technical metrics. The sysadmin or hardware vendor may still decide to claim that “Progress is doing it wrong” but the fact remains that the application is using OpenEdge and users are experiencing what they are experiencing. This end-to-end perspective helps the team to come together, think outside of their silos, and focus on solving the user problem.
On top of that our perspective across thousands of monitored systems means that we may very well have “proof of existence” that better performance is possible. In many cases we can point to other customers running the same application with a similar workload but with far better results. We can then pinpoint the configuration differences to suggest where the most likely areas for improvement can be found!
CPU
CPU performance is much more complicated than simply counting cores or comparing gigahertz. BogoMIPS is ProTop’s vendor neutral metric for measuring CPU performance as OpenEdge sees it, and we discussed it in our July newsletter. A higher number is better, and you want the value to stay fairly consistent. Wild swings in the value of bogoMIPS could indicate all kinds of bad things, like an underpowered or improperly provisioned server, NUMA-related configuration issues, or “bad code” running amok on your server.
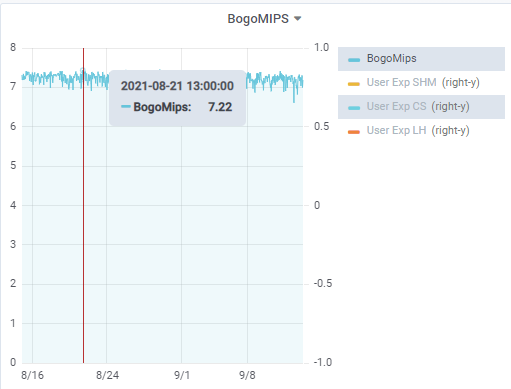
Generally speaking, you want to see consistent values with only a little “wiggling around” such as in the chart below. (The value of 7.2 comes from a Xeon Gold 6242 @ 2.8 GHz. Reasonably fast, in 2021 at least.)
If you see substantial “wiggle” appear out of nowhere, like this (prior to July 1), there is likely something worthy of investigation: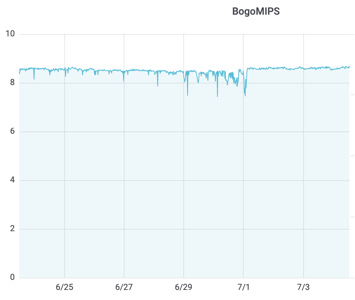
It could be a busy hypervisor, a “noisy neighbor”, unplanned workload, runaway processes, or something else. You would want to look at the classic CPU usage graphs (user, system, idle, wait io) first to see if there was anything interesting there. Those are available in the Server Trends dashboard in ProTop:
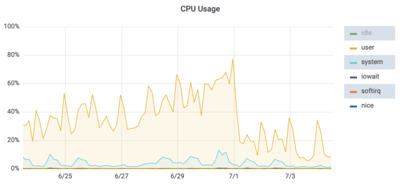
In this case we can see that there has been steadily rising CPU utilization. Primarily %usr so it is likely code execution rather than network activity, IO or kernel waits. A little bit of ad-hoc exploration on the server side suggested that app server processes were consuming an increasing percentage of CPU cycles and taking longer and longer to run:
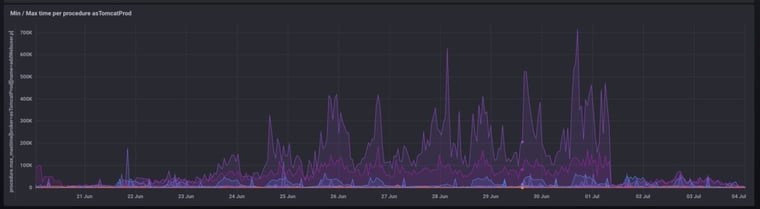
These processes were also slowly, but surely, growing their RAM footprint. In the short term the problem was quickly resolved (on July 1st) by cycling the appservers. Deeper investigation revealed a memory leak that had been recently introduced to the app server procedures and, once that was fixed, the problem was solved.
A much more obvious issue is when something like this happens: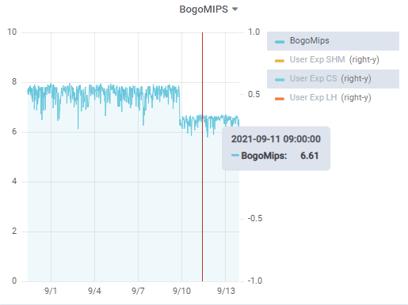
Who VMotion’d my server to a slower frame !?! The data doesn’t lie, so we know exactly when it happened. After a quick discussion with the sysadmin team the instance was moved back to the faster frame.
Disk Writes
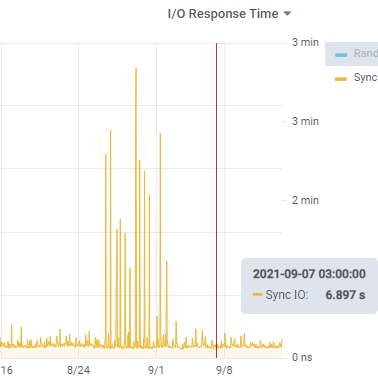
We also discussed SyncIO it in our July newsletter. This measure of unbuffered write performance is an excellent proxy for AI and BI write throughput. The metric is showing how long it takes for OpenEdge to do 96MB of synchronous writes. A value of 10 seconds (or roughly 10MB/sec) is typical for a SAN and is an “ok” value, whereas a value of 1 second or less (100MB/sec) is typical of locally installed flash or SSD drives. If you are seeing 3 minutes, you probably have a problem:
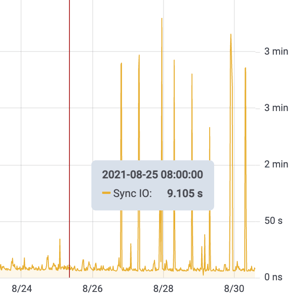
This is a situation when historical data comes in handy. Synchronous write performance was normal (not super good, but “ok”) until, on August 27th, it suddenly changed! So we shared the graph above with the crisis team. What changed? (“Nothing” of course!) But after a bit of reflection the storage team remembered that they “might” have started snapshotting the /db filesystem every few hours right around then… we suggested that such snapshots “might” not be such a good idea. Shortly thereafter the snapshots were stopped and application performance returned to normal:
Disk Reads
ProTop’s random reads metric measures small, single block random disk reads, which are typical of a OLTP business application. For this metric, you want to see low single-digit milliseconds at worst. Fractions of a millisecond are typical for local SSD storage:
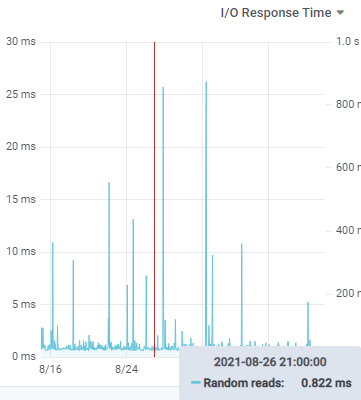
Occasional spikes are not uncommon but they should not happen consistently, if there is a pattern to the timing of spikes then there is probably an external driver of that pattern.
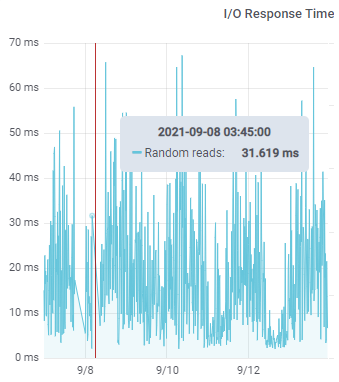
Graphs such as the one below are not “occasional” spikes. This kind of a profile is typical of overloaded shared storage devices. In 2021 it should not take 40-60 ms to read one 4K block from disk! Something is clearly bogging down random reads.
The usual solution to that sort of problem is to replace the storage system. Ideally with dedicated internal flash storage. Like this:
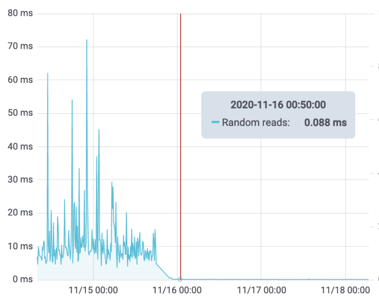
The new storage is more than 100x faster than the old storage! It was cheaper too. That’s a win-win!
Network and So Much More…
Holy smokes…we have so much information to share! I can’t believe my time is already up. We’ll have to leave the network metrics for another blog post.
What’s next?
Would you like to suggest a cool new feature for ProTop? Have any questions or comments? Head over to our community page at https://community.wss.com.
Interested in learning more about the free ProTop RT (Real-Time)? The help pages at https://help.wss.com contained detailed instructions on how to install and configure ProTop RT.
Intrigued by the monitoring and alerting aspect of ProTop? Install the free version first, then reach out to us to activate a free trial and show you around the commercial features.
Want to learn more about being an OpenEdge DBA? Sign up to get all our blogs and updates in your inbox and subscribe to our YouTube page.