
In the techie world, few things are as misunderstood as UNIX performance metrics. Grab a cup of coffee, sit down, and join me as I go over a few things.
Metrics shmetrics…what metrics?
There are many. Let’s start with a few CPU-related metrics, then we’ll tackle memory, disk, kernel, network and more in later blog posts.
CPU Usage
There are four basic CPU usage categories: user, system, wait on IO and idle.
- User is the real application work and should be the highest percent of CPU use
- System represents kernel stuff like context switches (cs) and basic housekeeping
- Wait/IO is a form of idle time, no useful CPU work is being done because a process is waiting for disk I/O to complete. This is NOT necessarily a bad thing and does NOT necessarily point to a disk bottleneck
- Last is Idle time, which is the CPU doing nothing
Typical CPU usage should be around 70-75%, not 100%! Running below 100% leaves adequate CPU resources for occasional peaks.
A decent allocation is about 50-60% User + 10% Sys + 10% Wait I/O. This is NOT a target, it’s a general feel-good spread of CPU activity. Know your server and trend CPU usage over time so that you can pinpoint sudden changes and plan for future needs. ProTop uses Influxdata’s Telegraf server agent to gather historical server metrics and trends them in the Server Trends dashboard.
Load Average
The load average represents the average system workload over a period of time, usually the past 1, 5 and 15 minutes. While the actual calculation is moderately complex, a simplified version states that the load average is the number of runnable process over the past 1/5/15 minutes.
You can see the load average by running the uptime command:
$ uptime
01:38:13 up 3:58, 3 users, load average: 15.54, 10.51, 8.00
Here we can see that in the past minute, 15-16 processes were runnable, but over the past 5 minutes, it was around 10-11.
Interpreting Load Average
When I’m presenting this kind of performance information at a conference, the first question is always “What is a good (or bad) number?” And the answer is often, maddingly, “it depends”. Sorry!
If you have 32 cores at your disposal, a load average of 16 means that half the CPUs have nothing to do. All 16 processes will get scheduled without delay and the system will have plenty of horsepower left over to handle even more load.
But if you have 2 CPUs…ouch. Each will be running one process and have 7 more waiting to get served. Imagine a grocery store with only two cashiers, each with 7 people waiting impatiently to pay for their groceries!
My rule of thumb: if your load averages are consistently 3 or more times the number of cores AND your CPU usage is always around 100%, you need to investigate and determine the root cause. Maybe you need more CPUs. Maybe you need to fix some bad code. Maybe something is misconfigured somwhere. If your load average is high but your user CPU usage is not, check for wait I/O. The bottleneck may be disk!
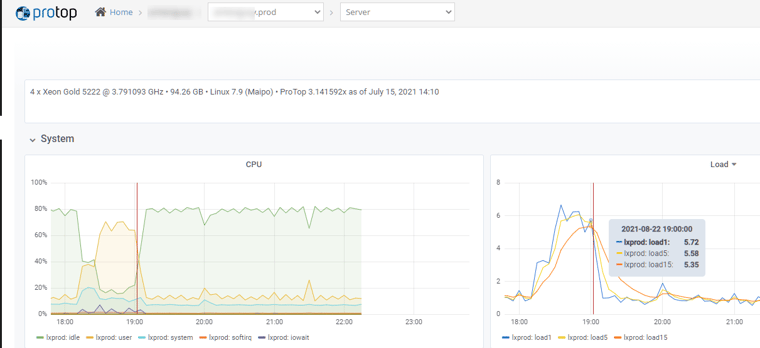
Here’s an example of CPU usage and load average graphs. Clearly the system got busy around 18:30, with user CPU hitting 70% and system CPU usage rising slightly. The 1-minute load average jumped above 6, and you can see how the 5 and 15 minute averages rose less abruptly. But the server has 4 cores, so a load average of 6 is nothing to worry about.
Context Switches
Another negative side effect of high load averages is context switches.
A context switch is when one process is booted off a CPU so that another process can get its turn. The exiting process needs to “remember” where it was so that it can continue where it left off the next time it gets a CPU quanta: the kernel needs to save that context. Similarly, the incoming process needs its context loaded before it can run.
If the load average is high, meaning that there are many runnable processes per CPU, then the kernel has to consume CPU time to fairly allocate CPU resources to all these processes. And the kernel has to use even more CPU time to save the outgoing process’ context and load the incoming process’ context so that it can continue where it left off. This is why heavily loaded systems often see an increase in sys CPU usage.
This means that a high load average is a kind of double-whammy: it indicates that your CPUs are likely overloaded AND it is often accompanied by an increased sys CPU usage related to frequent context switching!
Run/Blocked Queue
Staying in the same general theme of running processes and CPU usage, the “r” and “b” columns of the vmstat command show the “runnable” and “blocked” process queues.
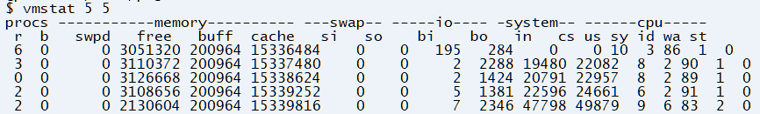 Runnable is pretty much self-explanatory: a process that is ready to use CPU resources. A blocked process is waiting for something, usually disk IO. Other processes are sleeping: i.e. they exist, but they are not actively requesting CPU time.
Here’s the running vs blocked vs sleeping processes graph for the same period as the CPU usage and load average graphs above:
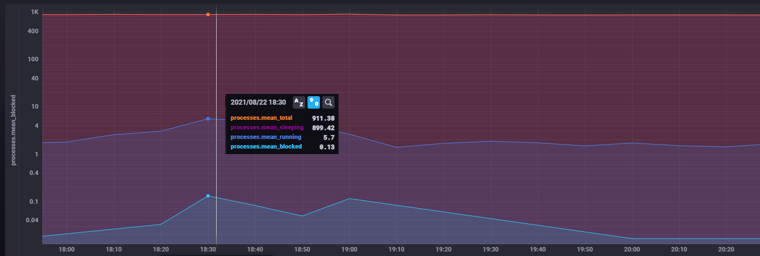
There were over 900 processes “running” on the server, but only 6ish (5.7) were actually requesting CPU access while the rest were sleeping.
Once the run queue starts getting higher than 3-4 times the number of CPUs, you’ll probably start seeing CPU bottlenecks.
As for the “blocked” queue, it should always be near zero.
CPU Takeaways
Any surprises here? Let us know in the comments.
But really: be smart! If you don’t know what “normal” is for your environment, how are you ever supposed to realize when your CPU usage becomes abnormal?
And if you haven’t already, read BogoMIPS Saves the Day.