
We got a call from a company that had been trying for months to find out how, where and why their system was slow. They had already spent thousands of dollars with system and OpenEdge consultants, all to no avail. ProTop found and reported the root cause in the first hour.
First thing first: record statistics
As we always do (and so should you!), we installed and configured ProTop to record as many statistics as possible for Progress and the operating system. As the first data points were coming in to the web portal, ProTop was already showing a few things worth digging into. (Quick note: most of the data shown below are available in the free version of ProTop, but this was a paid services engagement so some of the data and graphs shown below were provided by the commercial version of ProTop).
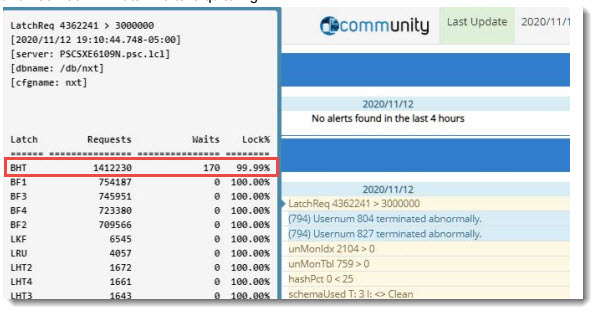
4.3M requests
1.4M BHT latch request per second and 170 latch waits is quite high. This is…unusual…for a 175 users environment.
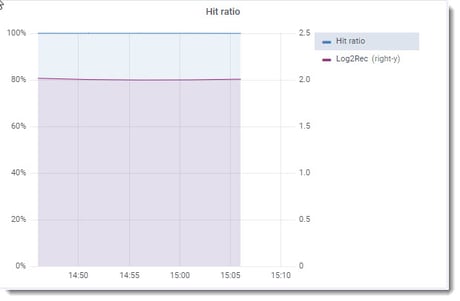
Let’s have a look at the first graphs: Logical DB reads/sec: 800K. This is quite read-intensive! Logical DB writes/sec: below 200, Hit Ratio is always at 100%: database blocks requested by a client are found in the database buffer pool rather than having to be read from the disk.
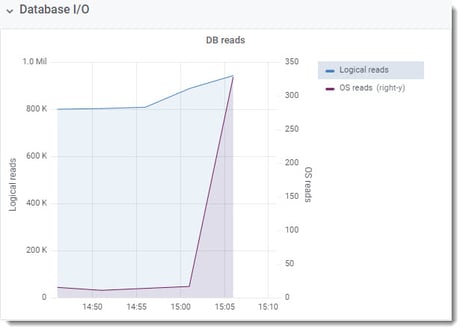
The customers explained they have multiple warehouse batch processing queues, which is why we can see this high level of DB Read, mostly from memory, but not enough to worry too much. We already knew from the ProTop alert that we had a lot of BHT requests and waits but how “bad” are the waits?
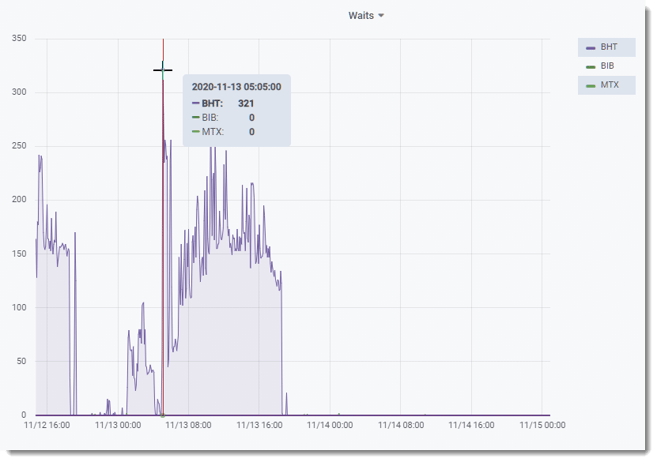
Switching the Portal’s view to the latches and resources page:
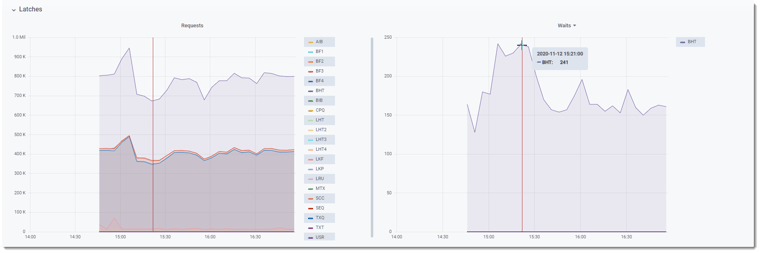
BHT: +800K latch requests/sec and BHT latch waits~150-250/sec – “Watson, it looks like we found a smoking gun!” – and the smoking gun looks familiar….
We’ve seen this in the past. There is some combination of user interface clicks and tabs in the database configuration screen that causes OpenEdge Explorer (OEE) to calculate and assign a value to the -hash parameter. Once it’s there – you are stuck with it as there is no way to remove it from the OEE screen!
BHT latch contention occurs when processes are fighting to access the Buffer Hash Table which requires a latch. We suspect that the BHT is too small and one of the consequences of these processes fighting for a latch is high CPU usage and low read throughput as processes wait to access data in the buffer pool.
Let’s check for evidence to confirm what we were looking at:
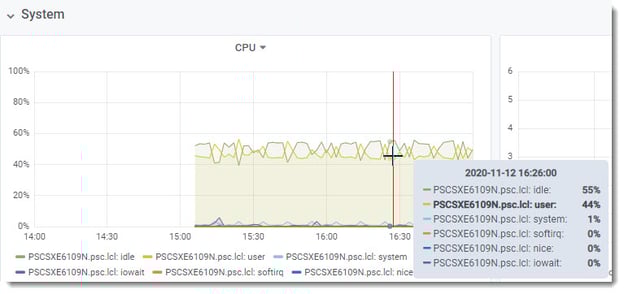
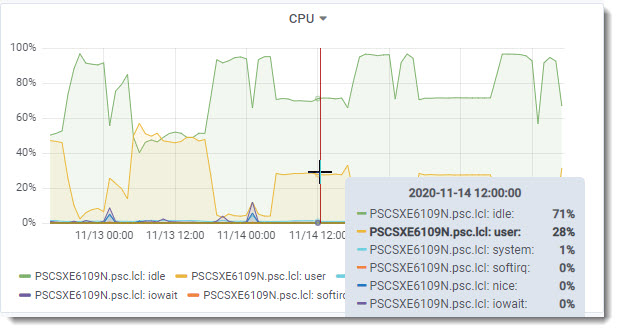
User CPU usage hovering above 50% all the time, so the customer is not starved for CPU resources.
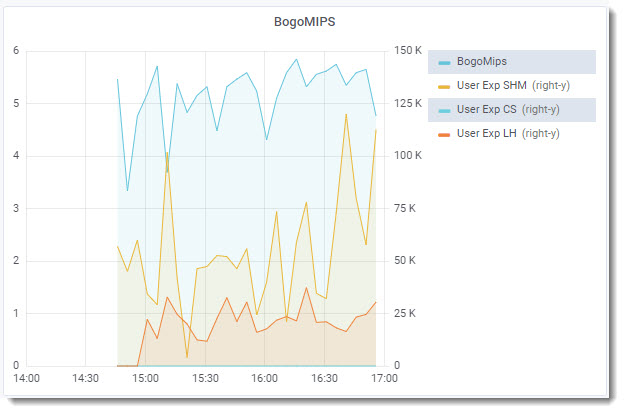
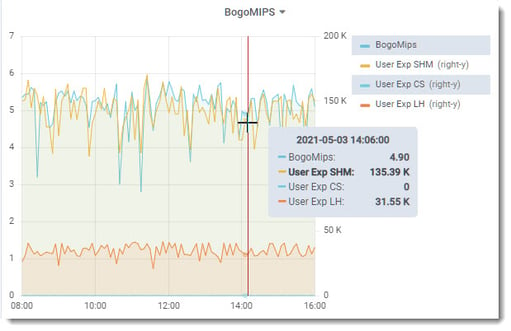
The ProTop User Experience Shared Memory metric varies wildly from ~25k rec/sec to ~115k rec/sec. Seems low.
Let’s have a look at the database startup parameters, -hash in particular:
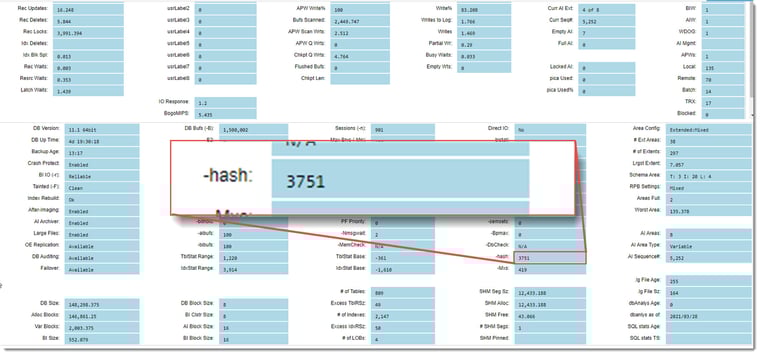
BINGO! -hash should be nearly 100x bigger, around 375k. This startup parameter sets the size of the buffer hash table and should be approximately one-fourth the size of database buffers (-B). Given the value of -B (1,5M), -hash should be ~375k. It is rare to set this value manually as the optimal value is auto-calculated by the broker on startup.
Wait…what? The -hash parameter?
Check out our YouTube page at https://www.youtube.com/c/WhiteStarSoftware: Paul did a super-techie-geeky video on the -hash parameter.
Remediation
Our first findings were critical enough that we suggested immediate remediation. Starting with a backup of conmgr.properties file, we removed the hashtableentry line before stopping and restarting the database. Let’s see what happened.
Take a wild guess what happened!
Can you guess when they restarted the database?
- BHT waits disappeared
- DB reads went from ~800k/sec to ~2M/sec
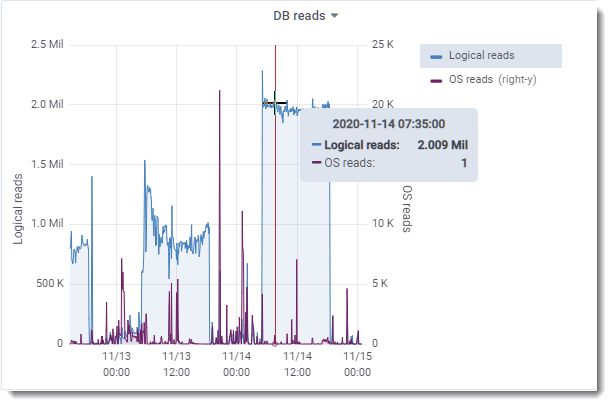
The difference was phenomenal. This simple correction more than doubled the number of reads per second and halved the time to run certain reports.
CPU usage was reduced by half and ProTop’s User Experience Shared Memory metric flattened out, averaging around 135K rec/sec.
Example report run times:
Next steps
Once this parameter was fixed, we recorded more data trends to continue our environment gap assessment. A number of low hanging fruit improvements were found and fixed a few weeks later when a new maintenance window was made available. The customer was super happy with the performance they were now getting out of their system so they decided to add more readers to improve their application response for their online application. DB reads went from 2M to 2.7M – and guess what? Users didn’t notice any performance drop!
Catching a smoking gun….effortlessly
In less than an hour, ProTop was able to report how, where, and why the system was slow after spending thousands of dollars with system and OpenEdge consultants. Take a step back and imagine how much time you will have to spend finding the same issue using any other tools available on the market?